


Monitoring Velero Kubernetes Backups & Automated Alerting for Backup Failures

This article is part of a series of blog posts on using Velero for Kubernetes backup, restore, migration & disaster recovery.
All articles in this series explore Velero in the context of AWS Elastic Kubernetes Service (EKS).
Stay tuned as we publish more articles in the coming weeks & months. Here’s a sneak preview of what’s to come:
- An Introduction to Velero for Kubernetes Backup & Restore
- Velero for Kubernetes Backup: Install & Configure
- Backup & Restore Stateless Workloads with Velero for Kubernetes
- Velero for Kubernetes: Backup & Restore Stateful Workloads with AWS EBS Snapshots
- Velero for Kubernetes: Backup & Restore Stateful Workloads with Restic for Velero
- Monitoring Velero Kubernetes Backups & Automated Alerting for Backup Failures
Introduction
So far in this article series, we have explored Velero in great detail. We learnt how to install & configure it, and use it to backup & restore stateless & stateful applications.
Now that you have Velero up & running, you would most likely schedule regular backups of your entire cluster & forget about Velero. But before you do that, there’s just one final thing to do: Configure automated monitoring & alerting for failed Velero backups.
Velero & Prometheus
If you installed Velero from a Helm chart, it comes fully-ready to be monitored by Prometheus. It emits several metrics, some of which are listed here:
- velero_backup_failure_total
- velero_backup_partial_failure_total
- velero_backup_success_total
- velero_backup_total
- velero_backup_tarball_size_bytes
- velero_backup_validation_failure_total
- velero_backup_duration_seconds
- velero_restore_failed_total
- velero_restore_success_total
- …and many more
As you can see, the metric names are pretty self-explanatory. Now, let us look at how we can get email alerts for failed backups.
Velero & Grafana
Like many others out there, we too use Grafana to visualize Prometheus metrics. This makes it very easy to:
- Create dashboards to monitor Velero backups
- Configure email alerts for failed backups
Here are the steps to configure dashboards & email alerts for Velero backup failures:
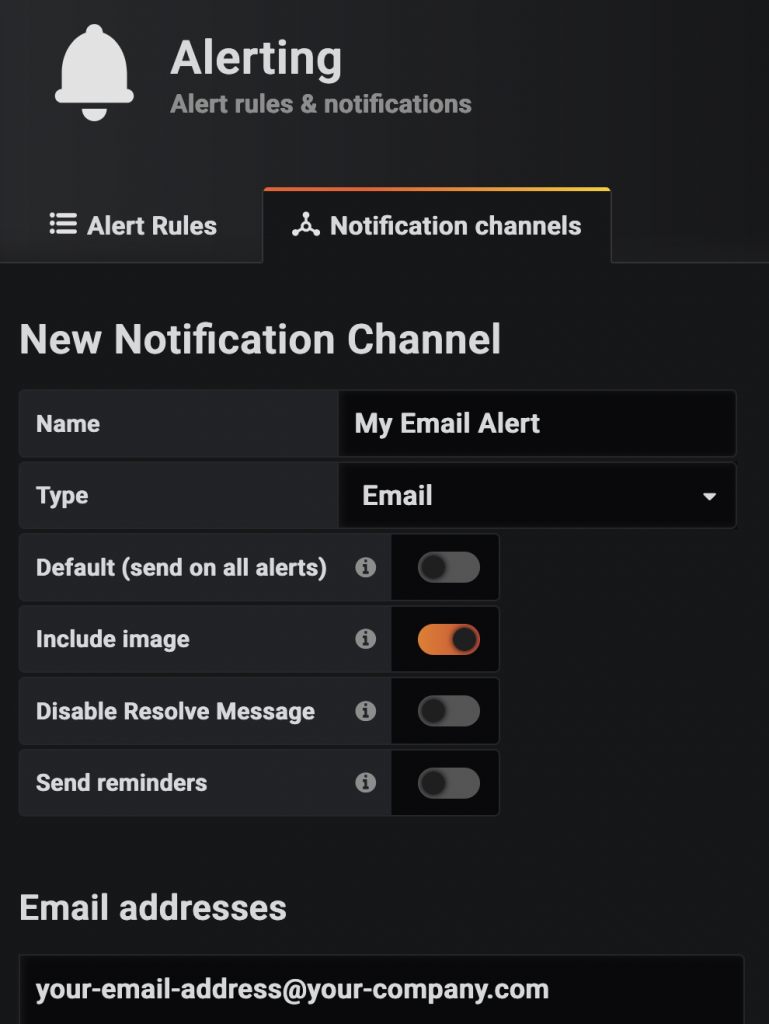
1. Add Grafana Notification Channel
Start by visiting https://your-grafana-host/alerting/notifications, click on the green Add Channel button & fill-up the form:
2. Add Velero Dashboard Panel
In the dashboard where you wish to monitor Velero, add a new panel with the following PromQL queries:
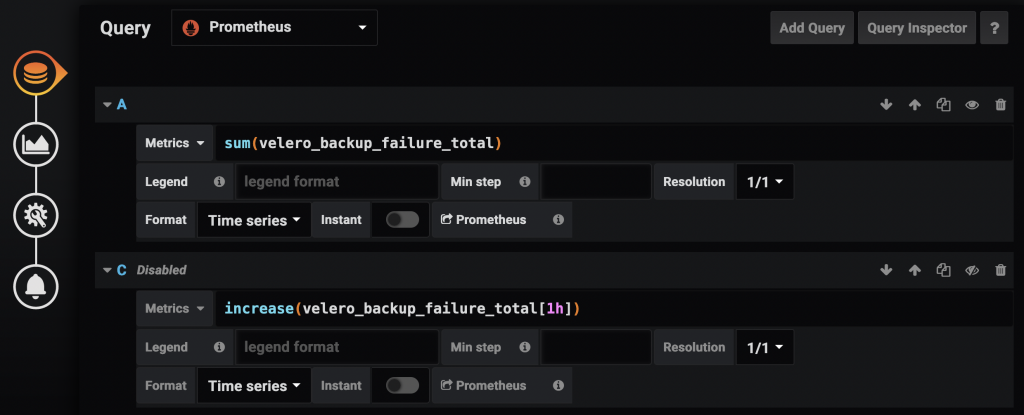
The first query sum(velero_backup_failure_total) shows the failing backups count on the panel. You should also add a query for sum(velero_backup_partial_failure_total) since partial failures are much more common than outright failures.
In most cases, you would have taken care of all the big reasons for complete failures when you installed Velero, like giving it permissions to AWS resources. As the workloads in your cluster evolve over time, errors might be introduced which might cause certain objects’ backups to fail.
For example, if you manually delete an EBS/EFS volume from AWS that some PV in your cluster is referring to, Velero will try to snapshot that volume / file system & fail when it can’t find the volume ID. Velero will log this & move on to backup other objects. Such backups are marked as PartiallyFailed.
The other query we added to the dashboard panel is increase(velero_backup_failure_total[1h]). This is a disabled query & not intended to be shown on the panel. It’s only required for the alert we will configure in the next step.
3. Add Alert for Backup Failures
The “increase” query above measures the increase in the number of failed backups in the last hour. You should add a similar query for partial failures as well: increase(velero_backup_partial_failure_total[1h])
Note: All time intervals in this section were designed for scheduled once-a-day backups. You should adjust the intervals according to the frequency of your backup schedule(s).
Next, switch to the alert section & create the alert as follows:
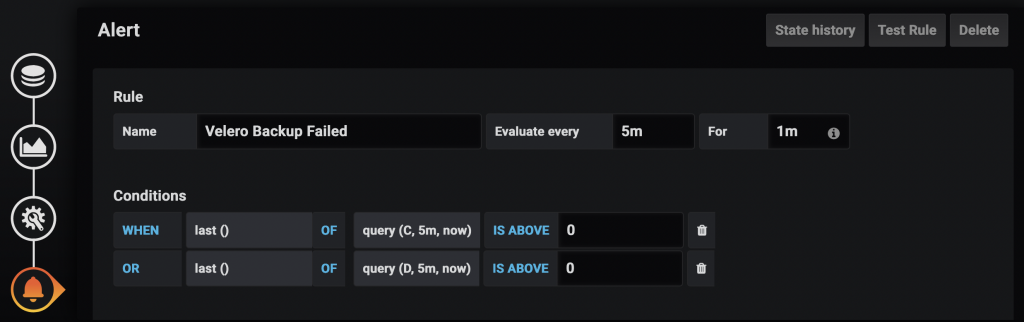
Assuming query C & query D in your Queries section are the “increase” queries for failed & partially failed backups, this alert evaluates them every 5 minutes & if the increase in failure count is > 0, the alert if triggered.
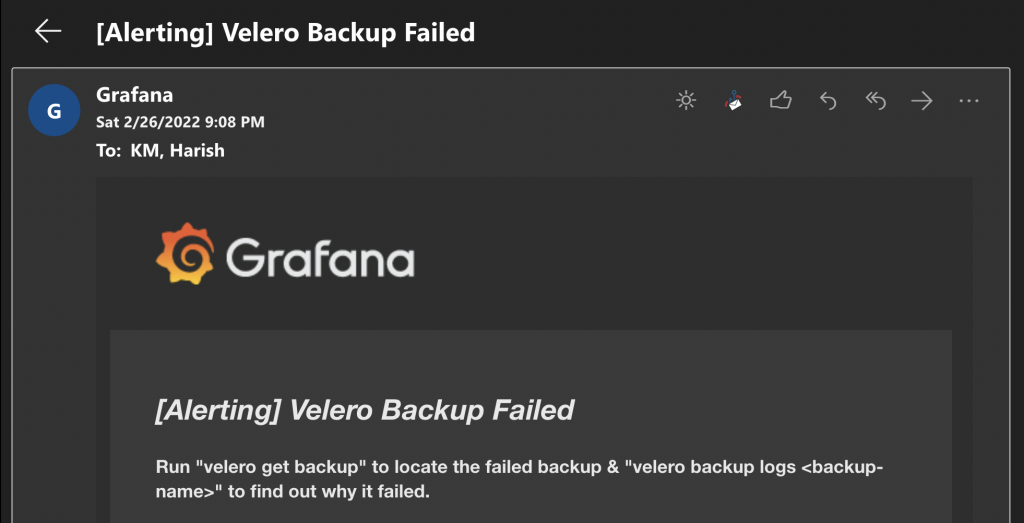
Scroll down & add the notification channel you created in step 1 & you’re done. You should now receive emails like this when backups fail: