






Who’s Talking to Prod? Auditing Cross-Environment Traffic Before You Segment a Flat AWS Network
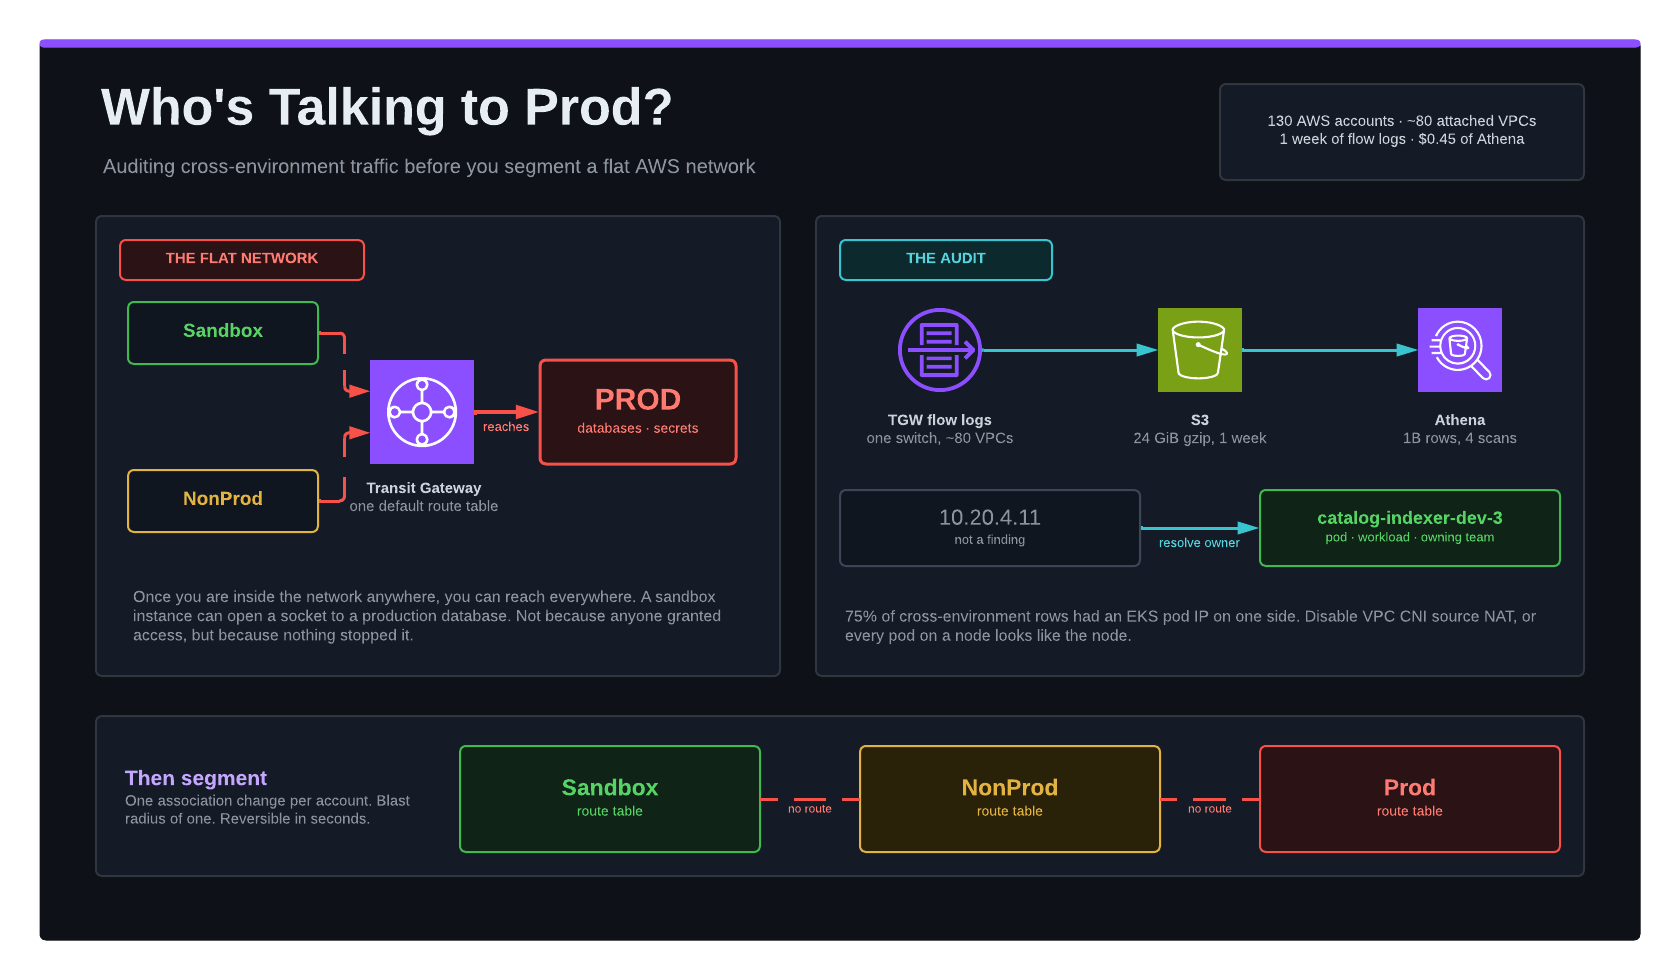
We inherited a flat network. When we migrated out of the data centre years ago, every VPC in every AWS account got attached to a single transit gateway, along with the on-prem network over Direct Connect. It worked, and it kept working, and nobody ever went back to it.
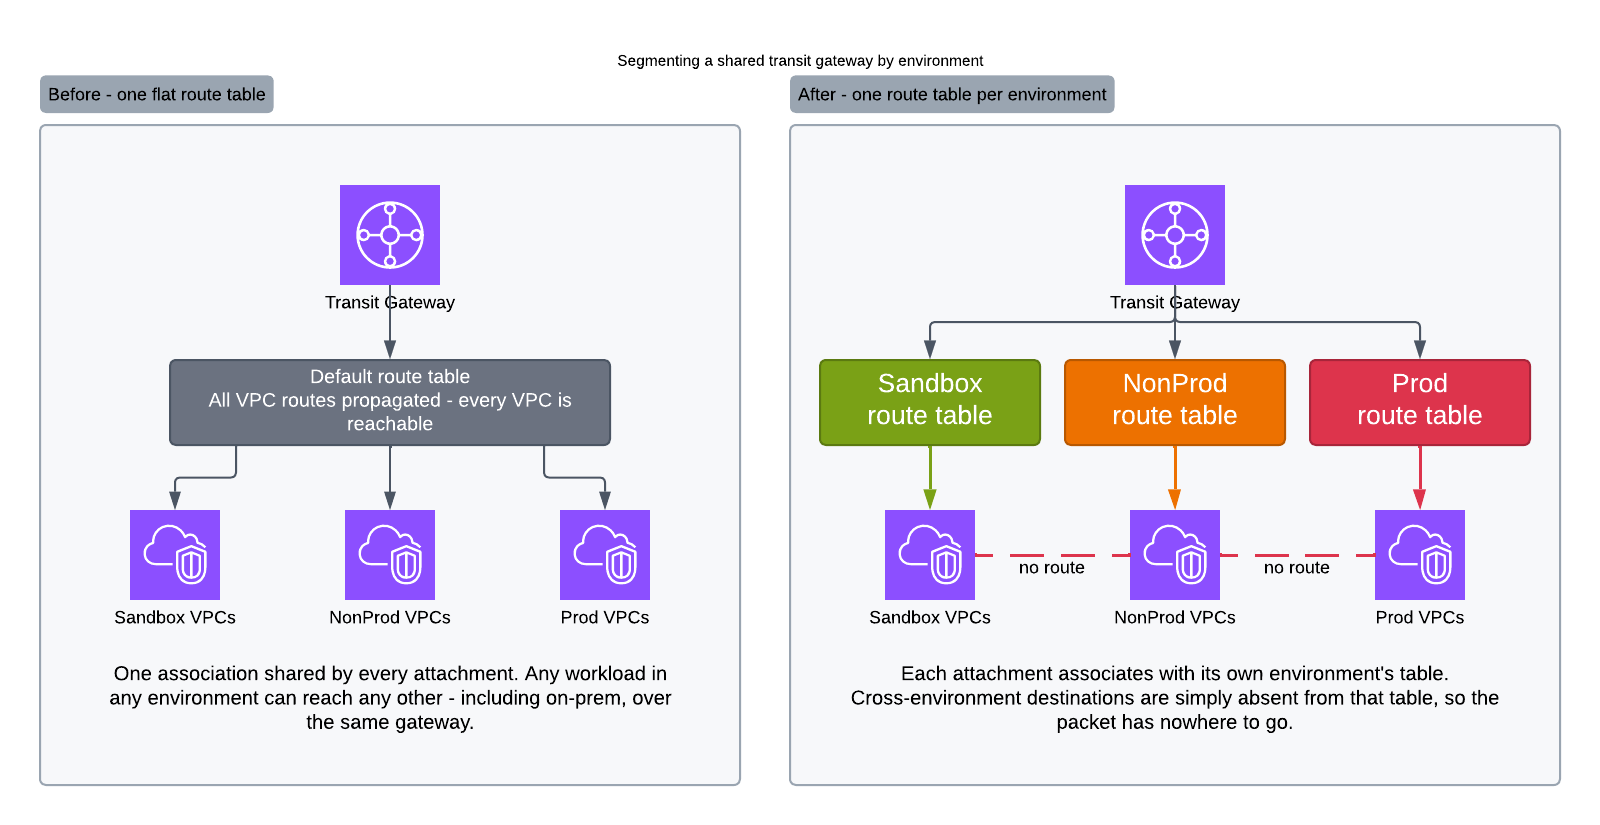
The arrangement has one property that eventually becomes hard to live with: once you are inside the network anywhere, you can reach everywhere. A sandbox EC2 instance can open a socket to a production database. Not because anyone granted it access, but because nothing stopped it. In our organization one AWS account belongs to exactly one environment, either sandbox, nonprod or prod, so the environment boundary was already crisp at the account level. It just wasn’t enforced anywhere in the network.
So we set out to segment the network by environment: sandbox traffic stays in sandbox, nonprod in nonprod, prod in prod.
The mechanism turned out to be the easy part. Transit gateway route tables do this natively, and the change is a handful of API calls. The hard part is that flipping those API calls on a network that has been flat for years will break things you don’t know about. Somewhere in 130-odd AWS accounts there are jobs, health checks, shared caches and forgotten cron scripts that quietly cross the environment boundary, and the team that owns each one has no idea it’s happening.
We needed to know who was talking to prod before we could stop them.
Why the transit gateway is the right place to look
The instinct is to reach for VPC flow logs. Resist it. VPC flow logs would mean configuring, funding and collecting from every VPC in every account, then stitching the results together across account boundaries. For a one-off audit that is a lot of moving parts.
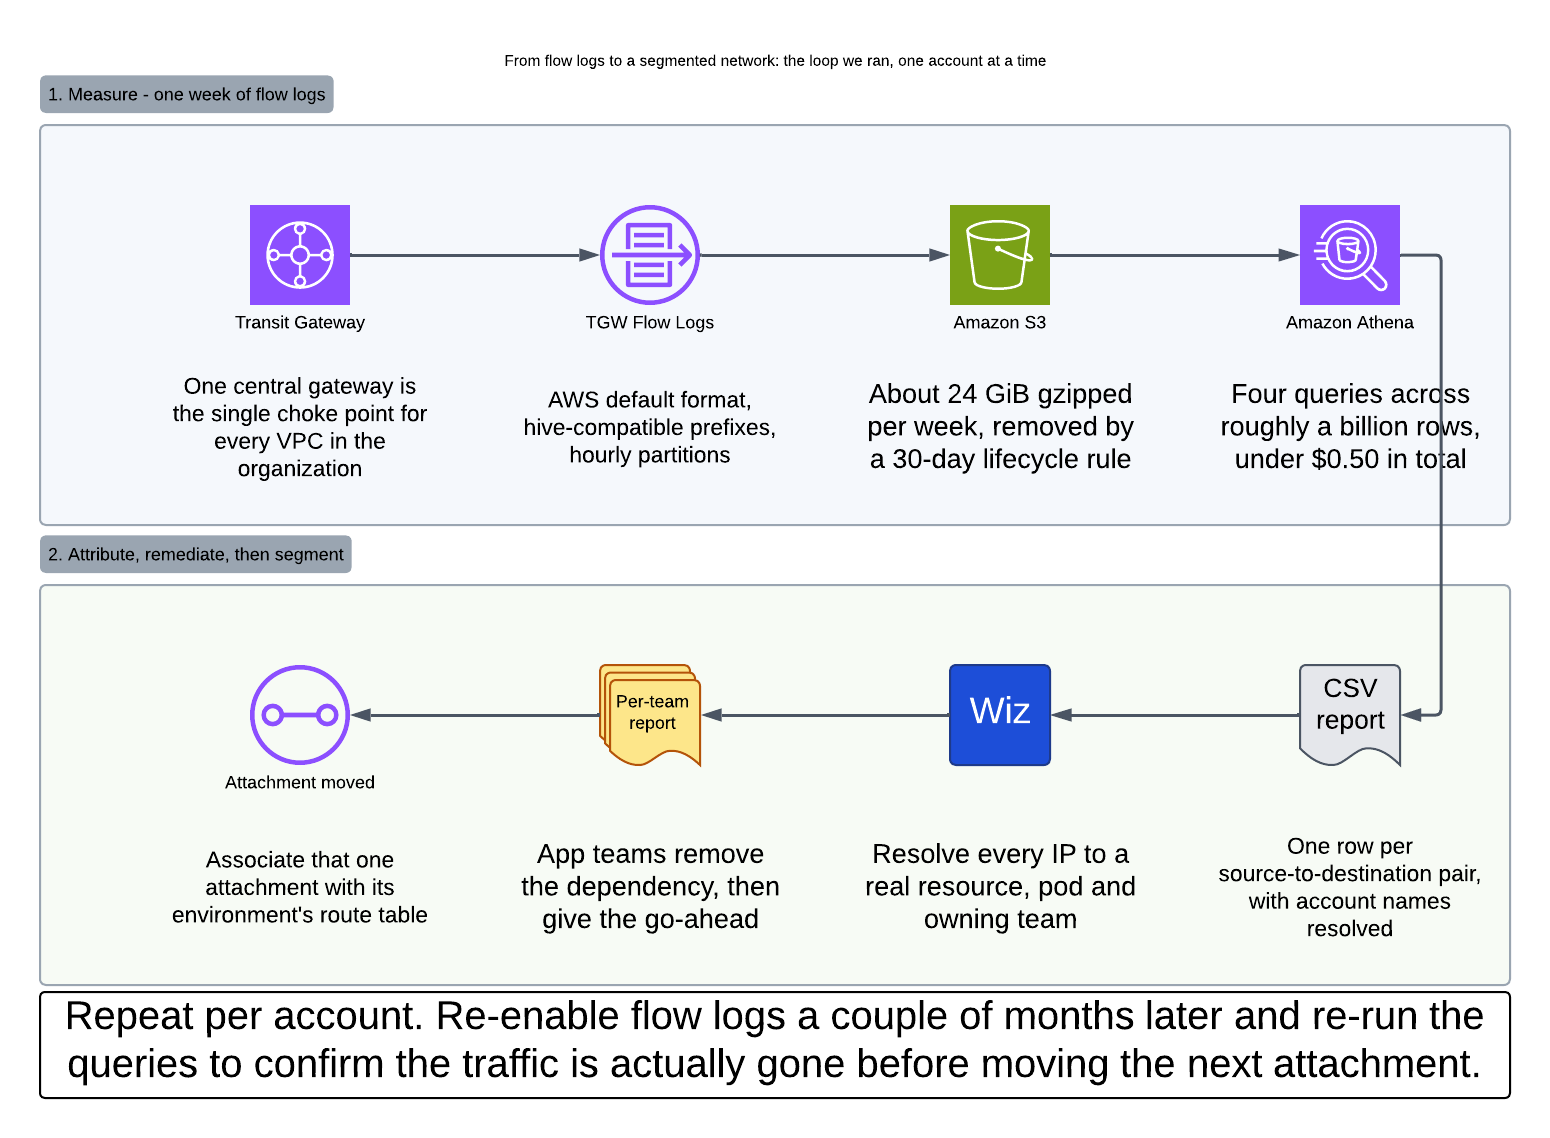
A central transit gateway is a single choke point that every cross-VPC packet in the organization has to traverse. Turning on transit gateway flow logs is one configuration change, in one account, that observes roughly 80 attached VPCs at once. Every cross-account conversation shows up in one dataset, already labelled with the source and destination account IDs, which is exactly the dimension we cared about.
That last detail matters more than it sounds. Transit gateway flow logs include tgw-src-vpc-account-id and tgw-dst-vpc-account-id. Because one account maps to one environment, those two fields alone tell you whether a flow crossed the environment boundary. No IP-range bookkeeping required.
Turning it on, deliberately temporarily
We enabled flow logs on the transit gateway with the AWS default record format, delivered to S3 as gzipped text, with hive-compatible S3 prefixes and hourly partitions.
Two of those choices are worth explaining.
Hive-compatible prefixes make the S3 layout look like year=2026/month=09/day=02/hour=14/, which is what Athena’s MSCK REPAIR TABLE expects. Without it you are writing ALTER TABLE ADD PARTITION statements by hand, or reaching for partition projection.
Hourly partitions rather than daily give you finer-grained partition pruning. We ended up not needing it, for a reason I’ll come back to.
Then the part I’d most encourage you to copy: we only left the flow logs on for a week, and we put a 30-day expiration lifecycle rule on the bucket.
A week of transit gateway flow logs at our scale is roughly a billion records, which lands in S3 as about 24 GiB of gzipped text across some 5,500 objects. The daily storage metrics from one of our capture windows show the shape of it clearly: the bucket grows about 3 GiB a day for seven days, sits flat while we run the queries, and then the lifecycle rule drains it back to nothing.
Nov 06   1.3 GiB     357 objects   <- flow logs enabled
Nov 13  21.7 GiB   5,536 objects   <- flow logs disabled, queries run
Dec 06  20.5 GiB   5,224 objects   <- 30-day lifecycle begins expiring
Dec 13   0.0 GiB      12 objects   <- gone
This is a sampling exercise, not a monitoring one. We are trying to enumerate a set of dependencies, and a week is plenty to catch daily and weekly jobs. Leaving flow logs on permanently would multiply the cost for no additional answer, and it would mean holding a detailed map of internal network dependencies in S3 indefinitely, which is its own risk.
We repeated the capture a couple of months later to check progress, and again after that. Same pattern each time: enable, wait a week, query, disable, let the lifecycle clean up.
The Athena table
The table definition is a straight positional mapping of the AWS default record format. The format is space-delimited, so the column names are yours to choose but the order is not.
CREATE EXTERNAL TABLE IF NOT EXISTS tgw_flow_logs (
  version int,
  resource_type string,
  account_id string,
  tgw_id string,
  tgw_attachment_id string,
  tgw_src_vpc_account_id string,
  tgw_dst_vpc_account_id string,
  tgw_src_vpc_id string,
  tgw_dst_vpc_id string,
  tgw_src_subnet_id string,
  tgw_dst_subnet_id string,
  tgw_src_eni string,
  tgw_dst_eni string,
  tgw_src_az_id string,
  tgw_dst_az_id string,
  tgw_pair_attachment_id string,
  srcaddr string,
  dstaddr string,
  srcport int,
  dstport int,
  protocol bigint,
  packets bigint,
  bytes bigint,
  start bigint,
  `end` bigint,
  log_status string,
  type string,
  packets_lost_no_route bigint,
  packets_lost_blackhole bigint,
  packets_lost_mtu_exceeded bigint,
  packets_lost_ttl_expired bigint,
  tcp_flags int,
  region string,
  flow_direction string,
  pkt_src_aws_service string,
  pkt_dst_aws_service string
) PARTITIONED BY (
  `aws-account-id` string,
  `aws-service` string,
  `aws-region` string,
  year string,
  month string,
  day string,
  hour string
) ROW FORMAT DELIMITED FIELDS TERMINATED BY ' '
LOCATION 's3://example-tgw-flow-logs/AWSLogs/'
TBLPROPERTIES ('skip.header.line.count' = '1');
Run MSCK REPAIR TABLE tgw_flow_logs after each capture window to pick up the new partitions.
You’ll notice none of our queries filter on year, month or day. That is not an oversight, it’s a consequence of the capture pattern: the bucket only ever contains the one week we are interested in, so a full scan and a filtered scan read the same bytes. If you leave flow logs running continuously, add the date predicate. It’s the single biggest lever on Athena cost.
Speaking of which, here is the entire Athena bill for a reporting run:
| Month | Athena spend |
|---|---|
| Month with no capture | $0.00 |
| Capture month | $0.47 |
| Month with no capture | $0.00 |
| Capture month | $0.42 |
Four full-table scans over a billion rows, about eleven cents each. Athena charges $5 per TB of data read from S3, and because the flow logs are gzipped, the 24 GiB on disk is what you pay for rather than the several hundred GB it represents uncompressed. DDL statements and partition management are free.
The dominant cost of this exercise is not Athena, it’s the flow log delivery itself, billed per GB of log data delivered at vended-log rates. I can’t give you a clean number for ours because the hub account delivers other vended logs that swamp it in Cost Explorer, so price that line item against your own traffic volume before you commit. Athena, though, is genuinely a rounding error.
Classifying accounts, and how not to do it
To find cross-environment flows you need to know which accounts are prod and which aren’t. We did the crude thing and wrote the mapping directly into the SQL:
SELECT
  CASE
    WHEN tgw_src_vpc_account_id = '111122223333' THEN 'Checkout Prod'
    WHEN tgw_src_vpc_account_id = '444455556666' THEN 'Catalog Prod'
    -- ... 74 more lines
  END AS "Source Account (Prod)",
  ...
WHERE tgw_src_vpc_account_id IN ('111122223333', '444455556666', /* ... */)
  AND tgw_dst_vpc_account_id IN (/* the nonprod list */)
It works, and for a one-week exercise it was faster than building anything. But 130 accounts of CASE WHEN is 300 lines of SQL that has to be maintained in four different query files, and the environment of an account is organizational metadata that already exists elsewhere.
If you’re starting fresh, put the mapping in a lookup table instead. Generate it from Organizations and whatever tag you use for environment:
aws organizations list-accounts \
  --query 'Accounts[?Status==`ACTIVE`].[Id,Name]' --output text > accounts.tsv
Land that in S3, define a small external table over it, and join:
SELECT src.account_name AS source_account,
       dst.account_name AS destination_account,
       f.srcaddr, f.dstaddr
FROM tgw_flow_logs f
JOIN account_env src ON src.account_id = f.tgw_src_vpc_account_id
JOIN account_env dst ON dst.account_id = f.tgw_dst_vpc_account_id
WHERE src.environment = 'prod'
  AND dst.environment != 'prod'
  AND f.log_status = 'OK'
GROUP BY 1, 2, 3, 4
Shorter, self-documenting, and it stays correct when someone adds an account next week.
Five things that will skew your results
This is the part I most wish someone had written down before we started.
The account that hosts the transit gateway is not a normal participant
Our transit gateway lives in the network hub account, and that account also owns the Direct Connect gateway and the site-to-site VPNs. So traffic from the on-prem data centre enters the flow logs tagged with the hub account as its source. If you classify the hub account as “prod” and leave it at that, every packet from every on-prem server shows up in your prod-to-nonprod report.
We handled it by treating the hub account as prod only when the source address is inside the hub VPC’s own CIDR:
WHERE (
    tgw_src_vpc_account_id IN (/* prod accounts, excluding the hub */)
    OR (
      tgw_src_vpc_account_id = '777788889999'   -- network hub
      AND srcaddr LIKE '10.10.%'                -- hub VPC CIDR only
    )
  )
Direct Connect and VPN attachments smuggle on-prem traffic into your VPC-to-VPC report
Related, but a separate filter. Every flow log record carries the attachment it arrived on. Excluding the Direct Connect gateway and VPN attachments by ID removes on-prem-originated flows that would otherwise look like cross-environment AWS traffic:
AND tgw_attachment_id NOT IN (
    'tgw-attach-0aaaaaaaaaaaaaaaa',  -- Direct Connect gateway
    'tgw-attach-0bbbbbbbbbbbbbbbb',  -- VPN
    'tgw-attach-0ccccccccccccccc'    -- VPN
  )
Worth knowing: tgw_attachment_id is the attachment for one side of the flow, and tgw_pair_attachment_id is the other. Filtering on one field catches one direction, which is part of why we also kept the CIDR guard above.
Direction in the log is not the same as who initiated
This one cost us the most rework. We built two reports, prod-to-nonprod and nonprod-to-prod, on the assumption they described different things. They don’t. When we compared them, 95% of the source-destination pairs in one appeared reversed in the other.
The reason is obvious in hindsight: a transit gateway logs both directions of a conversation. One TCP session between a prod host and a nonprod host produces records with prod as source and records with nonprod as source. Two reports, same conversations, viewed from either end.
The port distribution makes the point plainly. In our “prod to nonprod” report, the most common source ports were 53, 389, 445 and 88. Those are DNS, LDAP, SMB and Kerberos, which means the rows are overwhelmingly prod servers answering nonprod clients. Read naively, the report looks like prod reaching into nonprod. What is really happening is nonprod reaching into prod and prod politely replying.
If you need to know who opened the connection, the raw fields to reach for are flow_direction and tcp_flags, looking for records with the SYN bit set and no ACK. We didn’t do this, and we should have. For our purposes the account pair was enough to start the conversation with a team, but it made several of those conversations more confusing than they needed to be.
Ephemeral ports will inflate your report by a factor of 40
We produced a second pair of reports with ports included, grouping by source IP, source port, destination IP and destination port. Those went from about 2,400 rows to about 735,000.
Almost all of that growth is one client port per connection. Collapsing the ephemeral side, and keeping only the low-numbered service port, brings 735,000 rows back down to about 16,500 with no loss of meaning. A 44x reduction.
While you’re in there, look at what those rows actually contain. In ours, port 53 alone accounted for 49% of rows, and DNS plus Active Directory chatter, meaning Kerberos, LDAP, SMB and friends, accounted for 67%. Two thirds of the report was shared infrastructure doing exactly what it is supposed to do. That’s not a finding you send to an application team, it’s a platform decision about which shared services are allowed to span environments.
Filter on log_status
log_status = 'OK' drops NODATA and SKIPDATA records. Cheap, obvious, easy to forget.
Raw IPs are not a finding
At this point we had a clean, correct, useless report. Thousands of rows of 10.20.4.11 -> 10.40.11.132. No application team can act on that, and the platform team can’t route it to an owner.
What makes the report actionable is resolving each IP to a named resource and, through it, to a team. We used Wiz for this. Wiz is a cloud security platform that continuously inventories your cloud environment and builds a graph of resources and the relationships between them, which means it already knows which network interface held which IP and which workload that interface belonged to. We ran one graph query per unique IP, traversing from network address to network interface to the cloud resource that contains it:
query GraphSearch($query: GraphEntityQueryInput) {
  graphSearch(first: 1, quick: true, query: $query, projectId: "*") {
    nodes { entities { name, type } }
  }
}
{
"query": {
"type": ["NETWORK_ADDRESS"],
"where": { "address": { "EQUALS": ["10.20.4.11"] } },
"relationships": [{
"type": [{ "type": "OWNS", "reverse": true }],
"with": {
"type": ["NETWORK_INTERFACE"],
"relationships": [{
"type": [{ "type": "CONTAINS", "reverse": true }],
"with": { "select": true, "type": ["CLOUD_RESOURCE"] }
}]
}
}]
}
}A short Python script walks the CSV reports, collects the unique IPs, looks each one up, and writes Type and Name columns back into the file. 10.20.4.11 becomes VIRTUAL_MACHINE / catalog-indexer-dev-3, and suddenly a row is something a person can respond to.
If you don’t have Wiz
Most of this is reproducible with AWS Config. If you run an organization-wide aggregator, one advanced query gets you IP-to-resource across every account without needing a role in each one:
SELECT resourceId, resourceType, accountId,
       configuration.privateIpAddress,
       configuration.privateIpAddresses
WHERE resourceType = 'AWS::EC2::NetworkInterface'
aws ec2 describe-network-interfaces is the more direct route if you’re willing to assume a role per account. The ENI Description field is surprisingly good at naming the owner, because AWS populates it with things like the load balancer name or the EKS cluster the interface belongs to.
Where the native path runs out is Kubernetes, which for us was most of the problem.
The EKS wrinkle: pod IPs or nothing
My team runs the organization’s central EKS platform. Around 70% of all our applications run on it, which showed up in the flow logs exactly as you’d expect: 75% of the rows in our cross-environment reports had an EKS pod IP on at least one side, and 30% of the distinct IP addresses in those reports were pod IPs.
That is a lot of the report resting on one implementation detail, and the detail is this. By default the AWS VPC CNI rewrites the source address of pod traffic to the node’s primary IP when the destination is outside the VPC. Cross-VPC traffic over a transit gateway is outside the VPC. So by default, every pod on a node appears in the flow logs as the node.
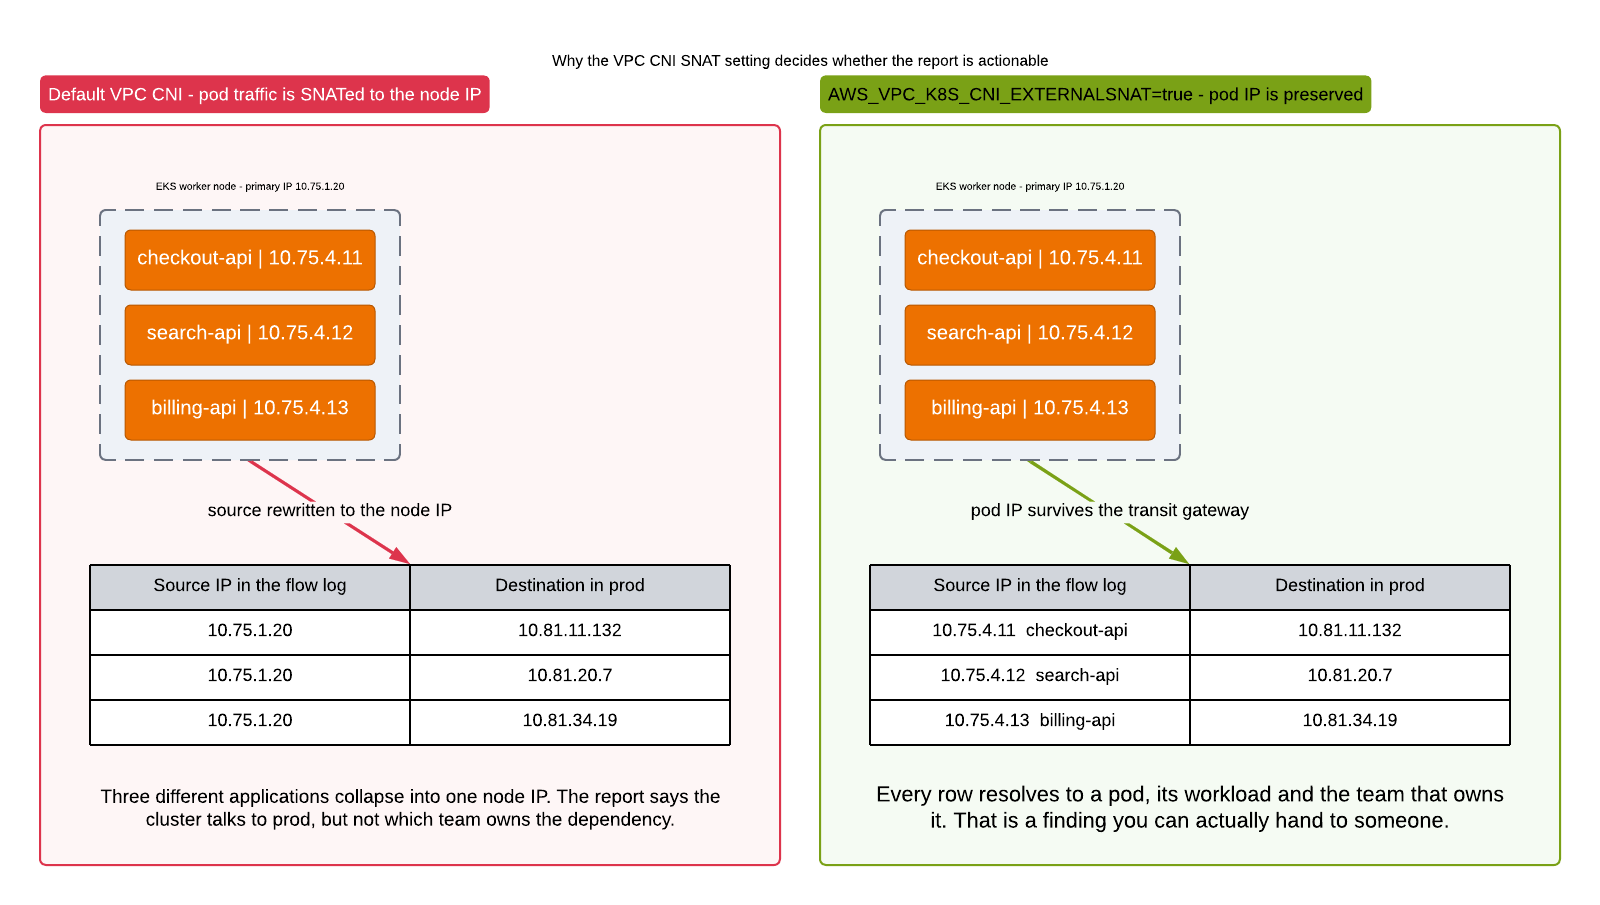
With the default, our report would have said “the cluster talks to prod” on a few dozen node IPs and stopped there. Since a shared platform runs workloads for many different teams on the same nodes, that is not a finding, it’s a shrug.
Our clusters run with source NAT disabled:
{
  "env": { "AWS_VPC_K8S_CNI_EXTERNALSNAT": "true" }
}
With that set, the pod’s own VPC IP survives across the transit gateway, lands in the flow log, and resolves through Wiz to a pod name, a workload and an owning team. This is where Wiz earned its place in the pipeline. AWS Config inventories ENIs, not pods, so it can tell you an IP belongs to an EKS node group but not which pod was using it. Nothing in the native tooling closes that gap.
Two caveats before you go and flip that flag. Disabling source NAT means pods no longer borrow the node’s path to the internet, so they need a route through a NAT gateway. And this is a cluster-wide networking change, so it belongs in a normal change window and not in the middle of an audit.
Worth noting what the audit told us about our own platform, too. Because a central platform hosts workloads owned by many teams, and because those workloads naturally call back to their owning team’s AWS account, the platform is the single largest generator of cross-environment traffic in the estate. The goal we set for ourselves was narrow and testable: pods in the prod cluster should only reach prod accounts, and pods in the nonprod clusters should only reach nonprod accounts.
Handing it over
We sliced the enriched reports per team and put them in a shared spreadsheet.
That is deliberately unglamorous, and it was the right call. A dashboard would have been nicer to look at and worse to act on. What application teams actually needed was to filter to their own rows, argue with a few of them, annotate the ones with a legitimate reason to exist, and tell us when they were done. A spreadsheet does all of that. Several teams found dependencies they did not know they had, which was the entire point of the exercise.
Then, finally, segmenting
Once a team confirmed their cross-environment traffic was gone, we moved their account.
Transit gateway segmentation rests on two independent knobs that are easy to conflate:
- Association determines which route table governs traffic leaving an attachment. Each attachment has exactly one.
- Propagation determines which route tables learn an attachment’s routes. An attachment can propagate into many.
We created three new route tables next to the original default one, then propagated routes into them well ahead of time. So the environment route tables were fully populated and correct long before anything was associated with them.
That sequencing is what makes the rollout safe. Because the destination table is already built, moving an account is a single association change:
aws ec2 replace-transit-gateway-route-table-association \
  --transit-gateway-attachment-id tgw-attach-0dddddddddddddddd \
  --transit-gateway-route-table-id tgw-rtb-0eeeeeeeeeeeeeeee
One API call. Blast radius of exactly one account. Reversible in seconds by pointing it back at the default table. We did this on a team’s go-ahead, one account at a time, over months.
There is a nice asymmetry that let us make progress without touching prod at all. Association only governs traffic leaving an attachment, but breaking one direction breaks the conversation. A prod VPC still sitting in the flat default table can still forward a packet to a migrated nonprod VPC, but when that nonprod VPC tries to reply, its egress is governed by the nonprod route table, which has no route back to prod. The reply is dropped and the TCP session never establishes. Moving the nonprod side alone is enough.
Two honest wrinkles
We worked outward from the lowest-risk environment. Sandbox first, then nonprod, with prod last: its route table exists and has its on-prem routes wired up, waiting for the environments around it to settle before anything moves into it. Doing it in that order means the early mistakes happen where they cost the least.
Two things about this that the tidy version of the story would leave out.
We allow a short list of exceptions. Three prod accounts propagate their routes into the nonprod route table: the network hub, the central EKS platform, and our shared operations tooling account. These are shared services that nonprod legitimately depends on, and cutting them would have meant standing up a duplicate of each per environment. Sandbox got the strict treatment, with no prod routes at all. Nonprod did not.
Pure isolation was never the goal; a small, explicit, reviewed exception list was. If you go down this path, expect to end up with one, expect the shared platform accounts to be on it, and expect it to be the thing you argue about most.
Segmentation is only as granular as your VPCs. Route tables act on attachments, and an attachment belongs to a VPC. Four of our clusters, including the sandbox one, share a single VPC, so they share one attachment and therefore one route table. No amount of route table work will separate them. Splitting environments across VPC boundaries is a decision you make when you build the platform, and it’s expensive to revisit. Something to weigh before your next cluster.
And the accounts still sitting in the flat default table are not all stragglers. Some have a real, documented reason to cross environments. Others belong to teams that need more time to change their applications. Both are fine. The measurement isn’t there to force a deadline, it’s there so that every remaining exception is a decision somebody made rather than an accident nobody noticed.
What I’d do differently
- Put the account-to-environment mapping in a lookup table from day one. The
CASEstatements worked and I still regret them. - Collapse the ephemeral port before writing the CSV. We shipped 90 MB files that could have been 2 MB.
- Aggregate
bytesandpackets. Our reports record that a conversation happened but not how much traffic it carried, so we had no way to tell a once-a-day health check from a continuous replication stream. Both look identical, and they deserve very different levels of urgency. - Use
tcp_flagsto infer who initiated. Would have saved several confusing conversations with app teams. - Cache the enrichment lookups on disk. Ours ran serially over thousands of unique IPs and only wrote results at the very end, so any API hiccup lost the whole run.
The short version
Segmenting a flat network is not really a networking project. The route table changes took minutes. Finding out what would break, getting it in front of the right teams, and waiting for them to fix it took months, and that is the actual work.
Transit gateway flow logs plus Athena is a cheap and precise way to do the finding-out. Around 45 cents of query spend told us which of 130 accounts were crossing the environment boundary. Getting from that answer to something a team would act on took two further steps that mattered as much as the query: resolving IPs to named owners, and making sure the IPs in the log were pod IPs rather than node IPs.
Enable the logs, take a week’s sample, answer the question, turn them off. Then start moving one account at a time.
Companion repository with the table definition, the queries and the enrichment script: aws-transit-gateway-flow-log-audit
 Linkedin