


Tracking Down a Rogue AWS API Caller in a Shared Amazon EKS Cluster

Table of Contents
- Introduction
- The Detection
- Querying CloudTrail
- Source IP
- The Investigation
- Confirming the Hypothesis
- Inspecting the Network
- Conclusion
Introduction
We build & maintain a number of Amazon EKS clusters, one for each environment: dev/test, perf, prod, etc. These are provided to tens of app teams across the organization, as a platform-as-a-service offering to host hundreds of apps. With some standardized deployment processes around it & some supporting tooling, this works out great as a shared platform for teams, who can abstract themselves away from the intricacies of maintaining such a platform.
The issue with any shared platform is attribution: attributing every aspect of the platform to individual workloads for cost, management & security purposes. Fairly distributing the cost of shared resources like storage & network, isolating an app’s usage of shared resources from another, isolating an app’s access to AWS services from another, these are all issues that any shared platform owner must address.
This is the story of one such incident wherein a seemingly rogue pod in our cluster was calling an AWS API that it’s not supposed to & how we tracked it down.
The Detection
It all began when we happened to notice a bunch of unauthorized AWS API calls in CloudTrail. Upon further investigation, the following patterns emerged:
- All errors originated from an assumed IAM role
- This was the IAM role we assign to all our EKS worker nodes
- The error occurred every few minutes in larger clusters & less frequently in smaller clusters
- Given a large enough window of time, like a day, the error originated from every node of the cluster
- The event source was always
ec2.amazonaws.com - The event name was always the
ec2:DescribeTagsAWS API call - The user agent of the API caller was always
rusoto/0.47.0 rust/1.62.0 linux- That’s Rusoto, the AWS SDK for Rust
- The error code was always
Client.UnauthorizedOperation - The error message was pretty standard:
- You are not authorized to perform this operation. User:
arn:aws:sts::111122223333:assumed-role/eks-worker-role/i-1a2b3cis not authorized to perform:ec2:DescribeTagsbecause no identity-based policy allows theec2:DescribeTagsaction
- You are not authorized to perform this operation. User:
- All API calls were targeted to the same VPC endpoint:
vpce-1a2b3c - Some calls used TLS version 1.2 with cipher suite ECDHE-RSA-AES128-GCM-SHA256, while others used TLS version 1.3 with cipher suite TLS_AES_128_GCM_SHA256
- All calls were made with similar request parameters:
{
  "filterSet": {
    "items": [
      {
        "name": "resource-id",
        "valueSet": {
          "items": [
            {
              "value": "i-1a2b3c"
            }
          ]
        }
      }
    ]
  }
}
Querying CloudTrail
Before we dive into the clues & start investigating, a quick note on querying CloudTrail. The aforementioned points would not have been apparent from the CloudTrail event history console. CloudTrail Lake is the go-to solution for querying CloudTrail with multiple parameters, but since we didn’t have it set up (yet), we chose Athena.
See Querying AWS CloudTrail logs to learn how to setup Athena to query CloudTrail. Tip: use partition projection for the fastest querying experience. Once you have the CloudTrail table in Athena, a simple query like the one below should return what you’re looking for:
SELECT *
FROM cloudtrail_logs
WHERE errorcode = 'Client.UnauthorizedOperation'
AND useridentity.arn LIKE '%eks-worker-role%'
LIMIT 10
Variations of this query can be used to aggregate results in different ways to draw insights. Notice the useridentity.arn WHERE clause. useridentity was declared as a STRUCT when CloudTrail’s Athena table was created, so Athena can query individual fields within useridentity, instead of treating it as a JSON string!
Source IP
First things first, can CloudTrail alone point us to the problematic pod? The only unique identifier we have across all those failed API call events, is the source IP, which is always the node IP, never the pod IP. Why? Because:
By default, the Amazon VPC CNI plugin translates the pod’s IPv4 address to the primary private IPv4 address of the primary elastic network interface of the node that the pod is running on.
— SNAT for Pods
This behavior might differ if you’re using another CNI.
Thankfully, there’s a way to expose pod IPs outside the cluster. By adding the AWS_VPC_K8S_CNI_EXTERNALSNAT environment variable to VPC CNI, you inform it that you have a NAT gateway outside EKS & so the CNI need not perform the Source Network Address Translation (SNAT).
If you use the EKS-managed VPC CNI addon, provide this env var as a configuration value:
{
  "env": {
    "AWS_VPC_K8S_CNI_EXTERNALSNAT": "true"
  }
}
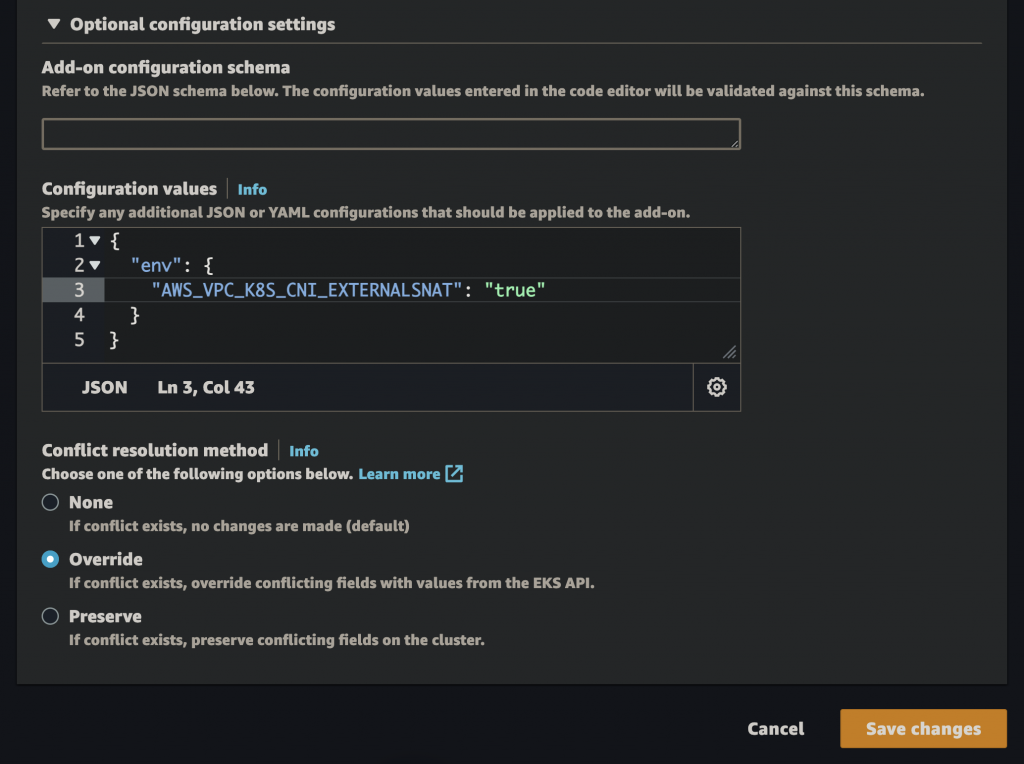
In our case, enabling external source NAT didn’t make a difference to the CloudTrail errors. The errors continued to originate from the node IP, not any pod IP. This means that it must be a pod that shares the host’s network namespace, instead of using its own. This is a BIG clue, as it narrows down the scope of investigation by a lot. Very few pods share their host’s network namespace & usually have a good reason to do so.
The Investigation
The patterns we observed in CloudTrail logs earlier, provide some very useful insights:
- Since all errors originate from the node role, they cannot be coming from any workload that uses IRSA: IAM Roles for Service Accounts
- Since the errors come from all nodes (over the course of a day), it must be a DaemonSet pod, or a very frequent CronJob, or a large deployment with many replicas
- Since the call is just the
ec2:DescribeTagsAPI & we don’t have any sensitive data in our instance tags, this is hopefully not malicious in nature, just some innocuous pod trying to read its own node’s tags, as evident from the request parameters - The Rusoto user agent could have been useful but not for us, since we weren’t aware of any Rust workloads in our cluster
- The error message of “no identity-based policy allows the
ec2:DescribeTagsaction” is expected since our node role doesn’t allowec2:DescribeTags - The use of VPC endpoint is expected because all our EKS worker nodes are in private subnets with a VPC endpoint for EC2
Narrowing down the list of suspects to DaemonSets reduces the scope of investigation down to the 20 or so foundational addons we deploy in our clusters. These include everything ranging from the essential EKS-managed addons like Kube proxy, Core DNS, CNI & CSI, to metrics & log collectors like Datadog, Sumo Logic, CloudHealth etc, to ingress controllers like NGINX, HA proxy etc, to other miscellaneous (but essential) addons like Karpenter, Flux for GitOps, Velero for backups & some runtime security monitoring tools.
Looking for DaemonSet pods is fairly straighforward:
kubectl get pods -A -o wide \
-o 'custom-columns=OWNER:.metadata.ownerReferences[0].kind,NAME:.metadata.name' | grep DaemonSet
# metadata.ownerReferences is not supported by --field-selector, hence the grep
But since we know that the API caller pod is sharing the host’s network namespace, just pick any node IP & look for pods with the same IP as the node:
kubectl get pods -A -o wide | grep 'A\.B\.C\.D' # Node IP
# status.hostIP is not supported by --field-selector, hence the grep
This returns:
- aws-node (VPC CNI)
- kube-proxy
- kubecost-network-costs
- security-agent
Since all of the above are using IRSA, except the security agent, that must be it!
Confirming the Hypothesis
What can we do to confirm that it is indeed the security agent making the rogue calls? Let’s try switching it to IRSA. Thereafter, CloudTrail errors should show the IRSA role as the source instead of the node role. To do this:
- Find the service account in use by the security agent pods & annotate it with:
eks.amazonaws.com/role-arn: arn:aws:iam::111122223333:role/any-IRSA-role
- Now perform a rolling restart of the security agent DaemonSet
- Wait a few minutes after all pods are been replaced then query CloudTrail again:
SELECT COUNT(*)
FROM cloudtrail_logs
WHERE eventtime > '<any-time-after-all-pods-were-replaced>'
AND errorcode = 'Client.UnauthorizedOperation'
AND useridentity.arn LIKE '%eks-worker-role%'
Hmmm… weird! The errors are still coming in. Moreover, running the same query on the IRSA role showed no errors, as we were expecting it to, since it too doesn’t have the ec2:DescribeTags permission.
Before we dismiss our hypothesis & go back to square one, let’s try something else. Let’s scale down the security agent temporarily & see if the errors stop during that time.
kubectl scale --replicas=0 daemonset/security-agentWait a few minutes, query CloudTrail again and… no more errors! That’s great. But then, why didn’t the IRSA trick work? Well, as it turns out, it’s technically possible for code in a pod to directly call the EC2 metadata URL http://169.254.169.254 & fetch the node role’s AWS credentials from it. Calls made using these creds will always show as originating from the node role, never the IRSA role! Since we don’t have access to the security agent’s source code, this explanation will have to do for now.
Inspecting the Network
Although we didn’t need to go this route here, you might need to employ one more trick if you find yourself in a similar predicament as ours. If it comes to it, you may resort to inspecting the network traffic originating from a pod inside a worker node. To do this, use the traffic destination as a filter to tcpdump. In this case, the VPC endpoint was the destination. Searching for the endpoint ID in EC2 console > Network interfaces should reveal all IPs of this endpoint, one per zone. Then, open up a terminal to one of your nodes and:
yum install tcpdump

tcpdump -i any host <endpoint-IP-A> \
or host <endpoint-IP-B> or host <endpoint-IP-C>

# If the above command captures too many packets and/or...
# you have an idea of which pod(s) might be causing the issue:

tcpdump -i any host <endpoint-IP-A> \
or host <endpoint-IP-B> or host <endpoint-IP-C> \
and host <each-pod-IP>
If you need advanced network inspection capabilities, consider yum installing Wireshark & use TShark to capture network packets.
This should (ideally) reveal the source of the traffic as one of your pod IPs. You can then confirm the issue by scaling down the workload temporarily & watching for continued errors.
Conclusion
This article aims to be both an account of how we tracked down a rogue pod in our EKS cluster & a guide for cluster operators in a similar position. The techniques demonstrated in this article can be used in other similar situations as well. And as a lesson learned, remember to adhere to EKS best practices. A couple of best practices that might have helped us here are to ensure the use of IRSA by all workloads & denying direct access to instance metadata URL.