


Export/Backup New Relic APM Metrics Using The NerdGraph GraphQL API

Table of Contents
Introduction
We recently migrated all our apps from New Relic to Datadog. One of the final steps in this migration, was to backup our New Relic data, just in case we ever need it. This article describes how we exported our New Relic data using their NerdGraph GraphQL API.
The Objective
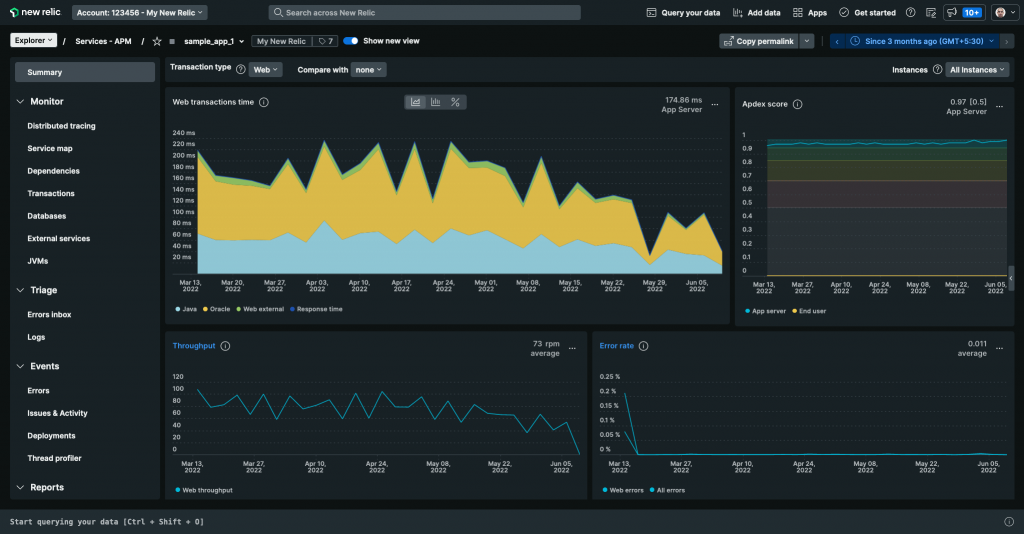
New Relic provides a summary dashboard for every APM-enabled application. The objective of this activity is to export the APM metrics you see in three of the graphs below:
- Web transactions time
- Throughput
- Error rate
The Approach
If you click on “View query” in the context menu of any of the graphs above, you’ll get the query written in New Relic Query Language (NRQL), that can be used to fetch the metric data, even from outside the New Relic web console:
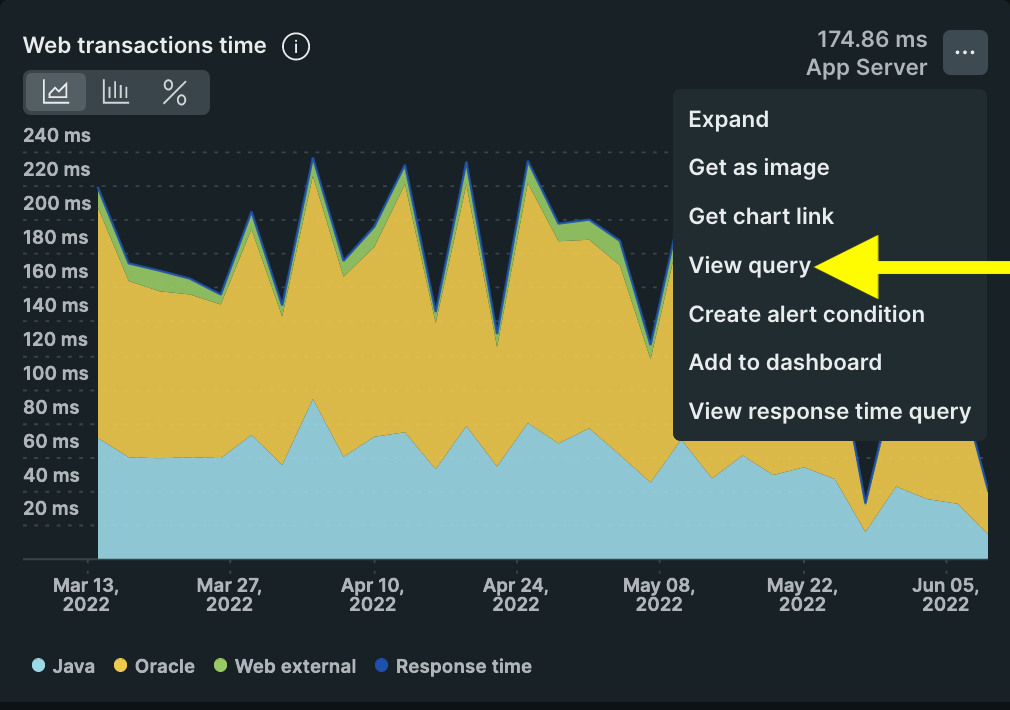
Doing this for all 3 graphs, here are the queries we got. ENTITY_GUID & SINCE_EPOCH are parameters that will be replaced with actual values before running the query.
Web transactions time
SELECT average(apm.service.overview.web) * 1000
FROM Metric
WHERE (entity.guid = 'ENTITY_GUID')
FACET `segmentName`
LIMIT MAX
SINCE SINCE_EPOCH
TIMESERIES
Throughput
SELECT rate(count(apm.service.transaction.duration), 1 minute)
  AS 'Web throughput'
FROM Metric
WHERE (entity.guid = 'ENTITY_GUID')
AND (transactionType = 'Web')
LIMIT MAX
SINCE SINCE_EPOCH
TIMESERIES
Error rate
SELECT count(apm.service.error.count) /
  count(apm.service.transaction.duration)
    AS 'Web errors'
FROM Metric
WHERE (entity.guid = 'ENTITY_GUID')
AND (transactionType = 'Web')
LIMIT MAX
SINCE SINCE_EPOCH
TIMESERIES
The Automation
Since we need to export these metrics for all APM apps in New Relic, we certainly need some scripting automation. This GitHub repo contains all the Python scripts you’ll need to do this yourself:
NerdGraph: New Relic’s GraphQL API
NerdGraph is New Relic’s GraphQL API. We will use a combination of several Python scripts calling GraphQL APIs to implement our automation.
References
Introduction to New Relic NerdGraph
New Relic GraphiQL — Use this to try out queries in your browser
Export your telemetry data with Python and the NerdGraph API
Fetch All APM Applications
The first step is to get a list of all APM apps whose metrics we plan to export. get_entities.py uses this GraphQL query to get all APM apps:
{
  actor {
    entitySearch(queryBuilder: {domain: APM, type: APPLICATION}) {
      query
      results(cursor: NEXT_CURSOR) {
        nextCursor
        entities {
          accountId
          guid
          name
        }
      }
    }
  }
}
The query results are limited to 200 per page. If you have more than 200 apps in New Relic, NEXT_CURSOR is used to fetch the next page of apps till all apps have been fetched.
The output is a list of apps in entities.json:
[
    {
        "accountId": 123456,
        "guid": "ZqykODgzfEFQTXx...PTnwyMDM0MzI3NDQ",
        "name": "sample_app_1"
    },
    {
        "accountId": 123456,
        "guid": "ZqykODgzfEFQTXx...PTnwyMjAwMDg0OTQ",
        "name": "sample_app_2"
    },
    {
        "accountId": 123456,
        "guid": "ZqykODgzfEFQTXx...PTnwyMDU4MDQ5NDM",
        "name": "sample_app_3"
    }
]
GraphQL for NRQL
Now that we have entities.json, get_metrics_wrapper.py reads it & fetches the desired metrics for every app. It uses this GraphQL query to run the NRQL queries we got from the New Relic web console earlier:
{
  actor {
    account(id: ACCOUNT_ID) {
      nrql(query: "NRQL_QUERY") {
        results
      }
    }
  }
}
Get Metrics
To trigger the metric collection, invoke one or more of these scripts, depending on which metric you’re after:
All of these simply prepare the respective NRQL query & pass it to the get_metrics function we saw earlier.
Output Metrics
The output of running these scripts is a collection of JSON files containing the relevant metrics:
metrics/
├── sample_app_1
│   ├── error_rate.json
│   ├── throughput.json
│   └── web_transactions_time.json
├── sample_app_2
│   ├── error_rate.json
│   ├── throughput.json
│   └── web_transactions_time.json
└── sample_app_3
    ├── error_rate.json
    ├── throughput.json
    └── web_transactions_time.json
Conclusion
The dataset of metric JSONs can now be preserved in a backup system & queried later if needed.