


Use AWS CloudWatch Synthetics Canaries to Monitor Your Production Website UI and Backend APIs Automatically

CloudWatch in AWS has grown over time to include a lot of features. Each of these tackles the challenge of application monitoring from a different perspective.
- CloudWatch Logs can be a central repository of logs generated by all components of your distributed application.
- Logs Insights lets you derive actionable insights from your logs and even extract custom metrics from them.
- Metrics collect telemetry from all over AWS and provide an outside-in view of your application’s health without having to dig into individual app components every time.
- Alarms can watch your metrics over time and send out alerts to interested parties when something interesting happens, as indicated by the metrics.
- Dashboards bring together disparate metrics from many AWS services in a single pane of glass for an overview of application status and serve as the entry point for troubleshooting issues when they occur.
- Events (now EventBridge) let you watch out for interesting events in your AWS account and take (automated) action when they occur.
- ServiceLens unifies metrics, logs, traces, and canaries to provide a holistic view of your entire application in one place. This is especially useful for observing highly distributed microservices-based applications.
- Container Insights enhances observability across your container apps in ECS, EKS, and Kubernetes. It also supports Prometheus!
- Lambda Insights, as the name implies, is all about your Lambda-based applications. Combine multiple Lambda functions into an application and monitor it as a unit.
- Contributor Insights: Analyze who or what is contributing most to system or application performance.
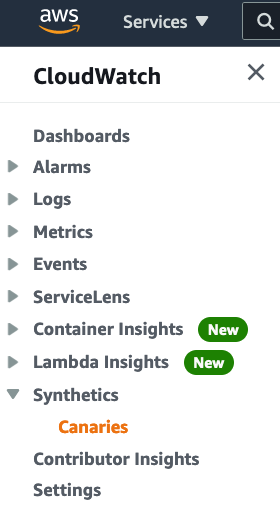
- Synthetics: Build automated canary tests to “synthetically” monitor all aspects of your production application, and take immediate action if and when failures are reported.
The focus of this article is CloudWatch Synthetics. We’ll look at how to build canary tests in Synthetics to monitor both a production website and also its backend APIs on a regular cadence.
CloudWatch Synthetics
As of now, CloudWatch Synthetics has a single purpose: to let you write canary tests. Canary tests or “canaries” are small, modular, lightweight pieces of code that simulate user interaction with your application. Canaries can be written in Node.js 12 or Python 3.8.
Think of canaries like Lambda functions that run on a schedule, visit your website, hit your APIs, etc, collect metrics about everything they did, and go back to sleep again.
Canaries use a headless Chromium browser to perform tasks like opening web pages and taking screenshots. When using Node.js, canaries use Google’s Puppeteer library to perform the tests, and when using Python, the hugely popular Selenium framework is used.
Puppeteer is a Node library that provides a high-level API to control headless Chrome or Chromium over the DevTools Protocol. It can also be configured to use full (non-headless) Chrome or Chromium.
Canaries check the availability and latency of your endpoints and can store load time data and screenshots of the UI. They monitor your REST APIs, URLs, and website content, and they can check for unauthorized changes from phishing, code injection and cross-site scripting.
— CloudWatch User Guide
Create a Canary
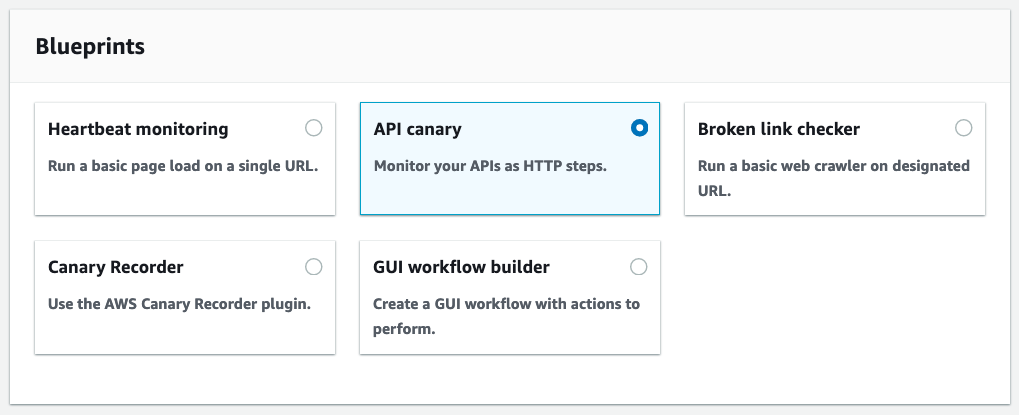
Let us now look at how to create a canary test for a website/API. Start by visiting console.aws.amazon.com/cloudwatch/home#synthetics:canary/create. The first thing you’re asked is “how would you like to create your canary?”
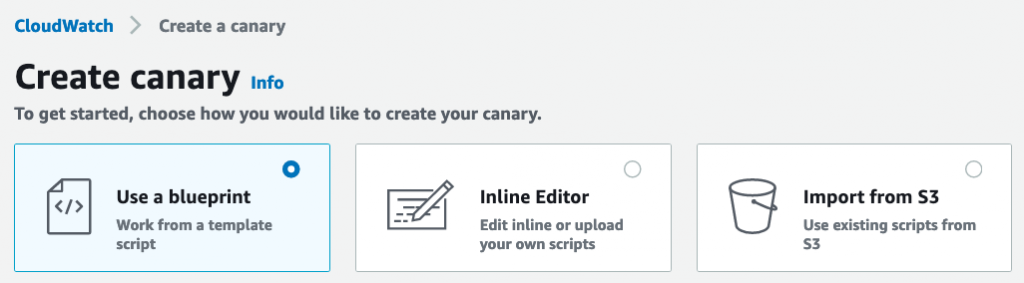
You can either start with a blueprint (like Lambda functions) and modify it to suit your needs or write the Node.js or Python code from scratch either in the console’s inline editor or upload the same to S3 and use it from there.
In this article, we will be creating two canaries: one to test our website’s UI and another to test our backend APIs. Both can be built starting from a blueprint so we’ll start there.
Canary for Website UI
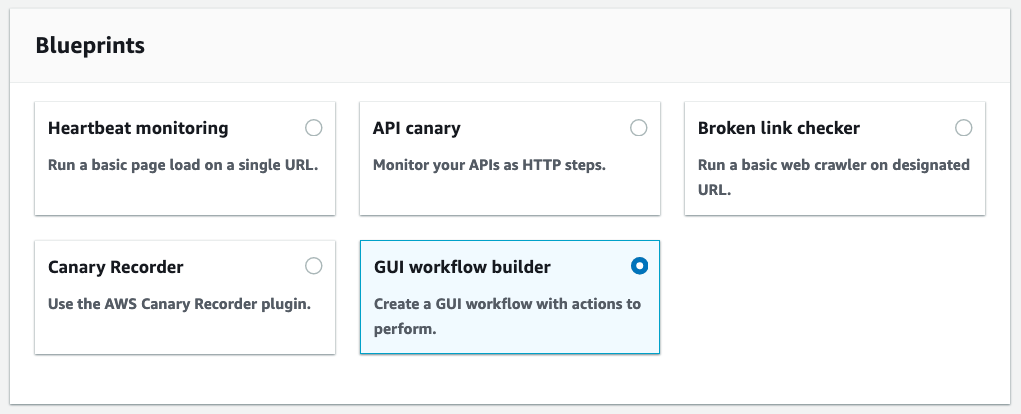
For this canary, select the “GUI workflow builder” blueprint:
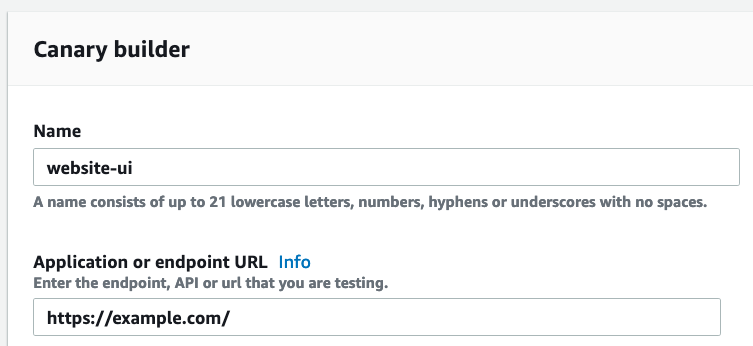
Provide a name to the canary and provide the URL of the website to visit:
Next, you add the steps you wish to perform on the website once it’s loaded in the headless Chromium. These steps could be as simple as checking that all UI elements are where they should be or as complex as simulating an entire checkout flow.
example.com is a very simple website so we’ll just add a couple of steps here: one to check the website’s heading and another to click the “more info” link and check that it works as expected:
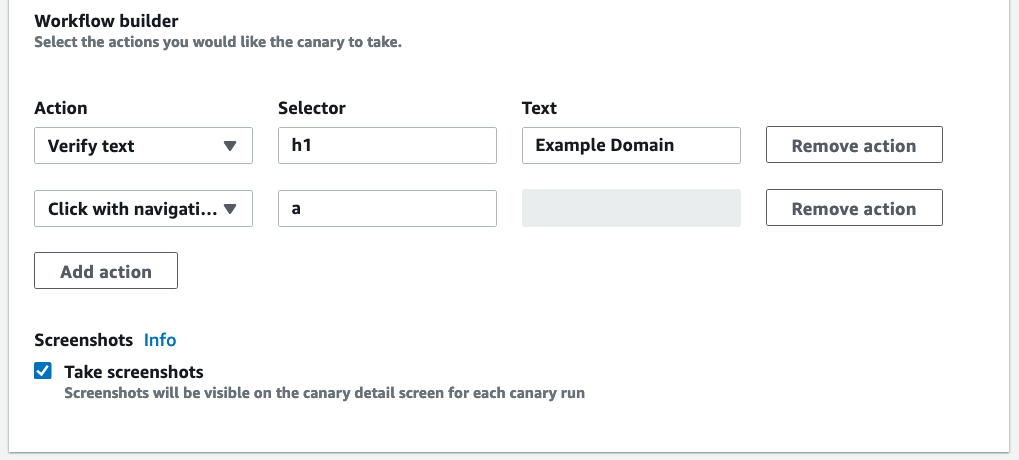
In our case, the website elements don’t have unique identifies which can be provided as selectors for the UI actions so we have used h1 and a as the selectors since there are only one of these on the page.
Enabling screenshots is a great idea on UI tests. These will be uploaded to S3 and available in the test results UI after the tests complete.
Next, you’ll see the script that was generated for the UI test steps you provided. As mentioned earlier, the code comes in two flavors: Node.js and Python:
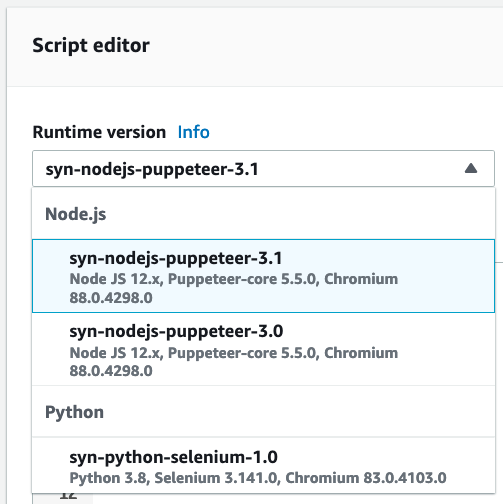
Take a look at the generated code. You’ll need to write your own as you grow into more complex test cases:
var synthetics = require('Synthetics');
const log = require('SyntheticsLogger');
const flowBuilderBlueprint = async function () {
// INSERT URL here
let url = "https://example.com/";
// Get synthetics configuration
let syntheticsConfig = synthetics.getConfiguration();
// Set configuration values
syntheticsConfig.setConfig({
screenshotOnStepStart : true,
screenshotOnStepSuccess: true,
screenshotOnStepFailure: true
});
let page = await synthetics.getPage();
// Navigate to the initial url
await synthetics.executeStep('navigateToUrl', async function (timeoutInMillis = 30000) {
await page.goto(url, {waitUntil: ['load', 'networkidle0'], timeout: timeoutInMillis});
});
// Execute customer steps
await synthetics.executeStep('verifyText', async function () {
await page.waitForXPath("//h1[contains(text(),'Example Domain')]", { timeout: 30000 });
});
await synthetics.executeStep('redirection', async function () {
await Promise.all([
page.waitForNavigation({ timeout: 30000 }),
await page.click("a")
]);
});
};
exports.handler = async () => {
return await flowBuilderBlueprint();
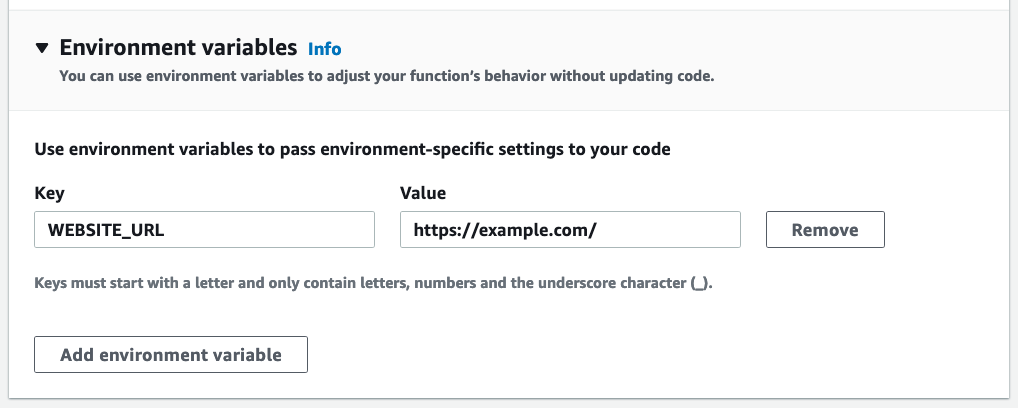
};Line 6 hard-codes your website URL. You could move this into the Lambda function’s environment variables as well:
Lines 13 to 15 enable screenshotting at every stage. This might be a bit excessive based on your use case. If you end up with a lot of repeating screenshots, like the same screenshots for the end of a test step and the beginning of the next step, you might want to turn off screenshots at certain points, say, before the test steps.
Lines 25 to 35 are the steps we’re interested in. This is the code you’ll build upon as your test cases grow.
Here is the same code in Python if you prefer that. This uses Selenium instead of Puppeteer:
import asyncio
from aws_synthetics.selenium import synthetics_webdriver as syn_webdriver
from aws_synthetics.common import synthetics_logger as logger, synthetics_configuration
TIMEOUT = 10
async def main():
url = "https://example.com/"
browser = syn_webdriver.Chrome()
# Set synthetics configuration
synthetics_configuration.set_config({
"screenshot_on_step_start" : True,
"screenshot_on_step_success": True,
"screenshot_on_step_failure": True
});
def navigate_to_page():
browser.implicitly_wait(TIMEOUT)
browser.get(url)
await syn_webdriver.execute_step("navigateToUrl", navigate_to_page)
# Execute customer steps
def customer_actions_1():
browser.find_element_by_xpath("h1[contains(text(),'Example Domain')]")
await syn_webdriver.execute_step('verifyText', customer_actions_1)
def customer_actions_2():
browser.find_element_by_xpath("a").click()
await syn_webdriver.execute_step('redirection', customer_actions_2)
logger.info("Canary successfully executed")
async def handler(event, context):
# user defined log statements using synthetics_logger
logger.info("Selenium Python workflow canary")
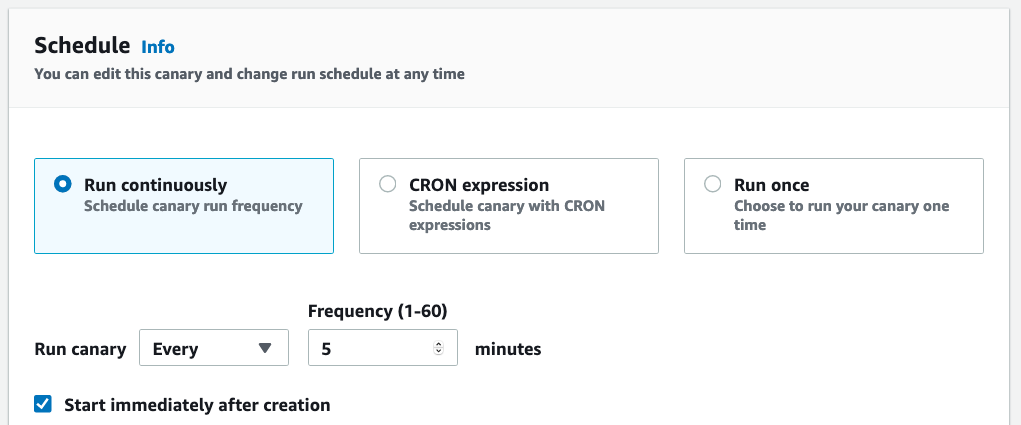
return await main()Next, you define the schedule when you want the canaries to run. It can be run on a schedule or just once if you are testing out the canary itself:
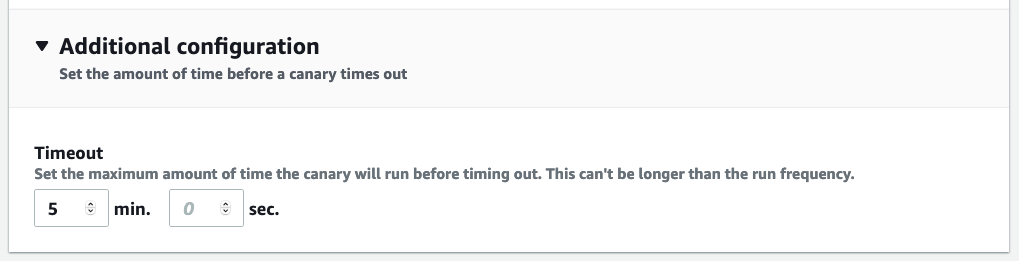
Provide a timeout for the canary so it doesn’t run indefinitely in case there is a serious issue with the website:
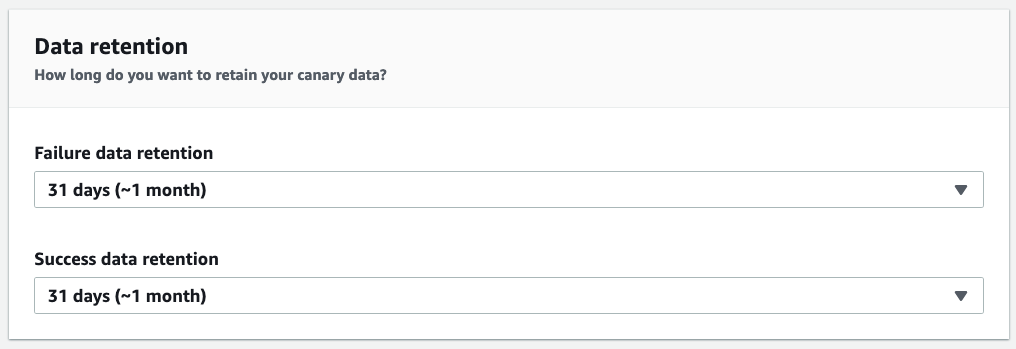
You can save the canary test results anywhere from 1 to 12 months:
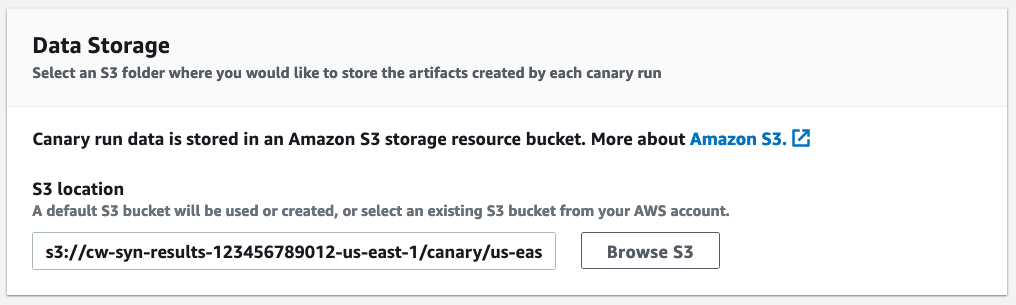
All canary data like screenshots are stored in an S3 location you specify:
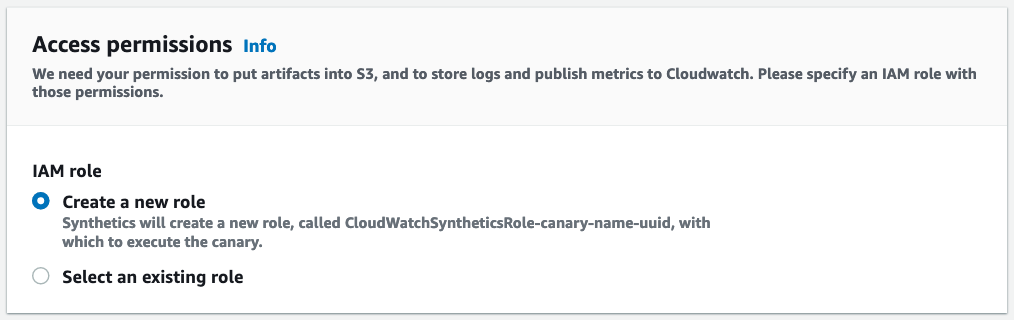
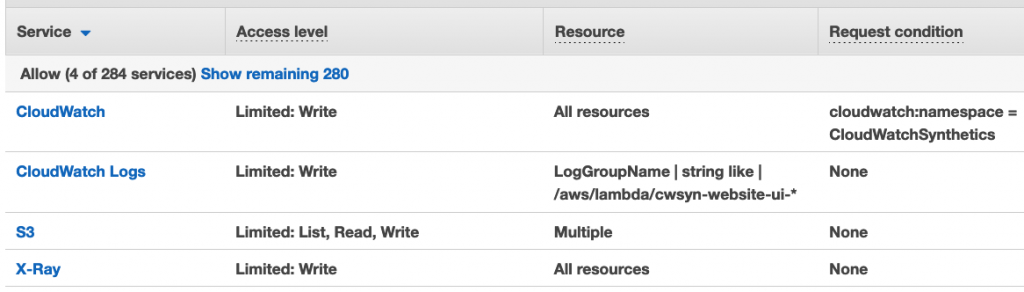
It’s best to let the console create an IAM role for now as this will have the exact permissions needed for every aspect of the canary test like sending metrics and logs to CloudWatch, saving files to S3, etc:
If you’re curious, here are the permissions granted by the UI:
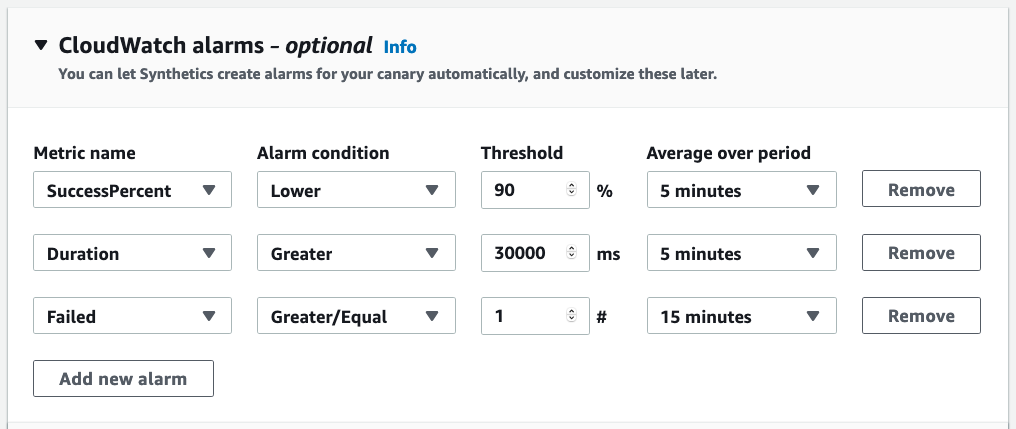
Next is CloudWatch alarms. Although these are optional, I highly recommend creating at least one alarm that will alert you in case canaries start failing.
Canaries generate 3 metrics: SuccessPercent, Duration, and Failure. Set alarms for SuccessPercent lower than a threshold, Duration greater than a value that’s abnormal for your test, and Failure count greater than (ideally) 0:
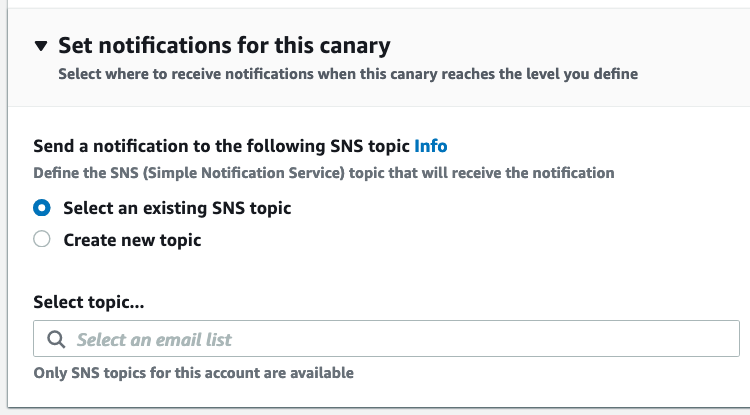
As with all CloudWatch alarms, you provide an SNS topic where you wish to be notified:
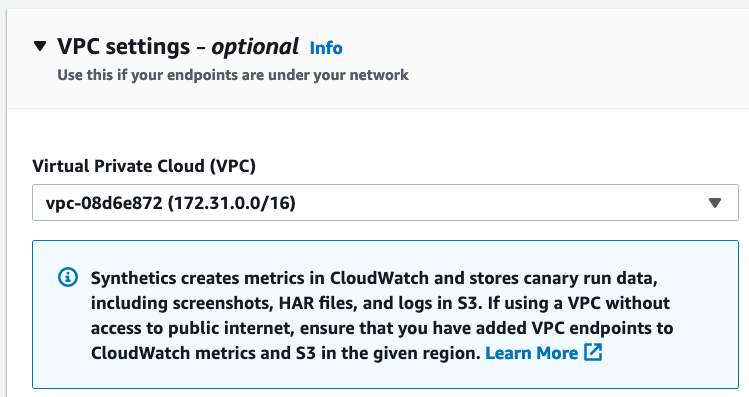
Just like normal Lambda functions, canaries also get created in an AWS-provided VPC for Lambda. If you need to access resources in your VPC from the canary code, or you just want the canary secured in your own VPC, you can choose to provide it a VPC. However, remember that you’ll need to set up access from Lambda to all the services necessary, like S3 for screenshots, and internet access if required:
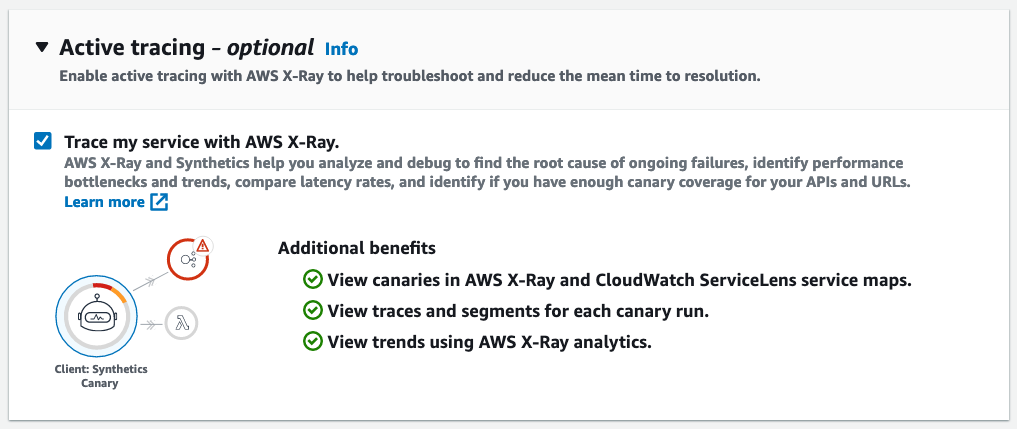
A really cool feature of canaries is the ability to integrate with X-Ray. This lets you use ServiceLens for additional troubleshooting help if needed:
Finally, click Create Canary to create the canary test.
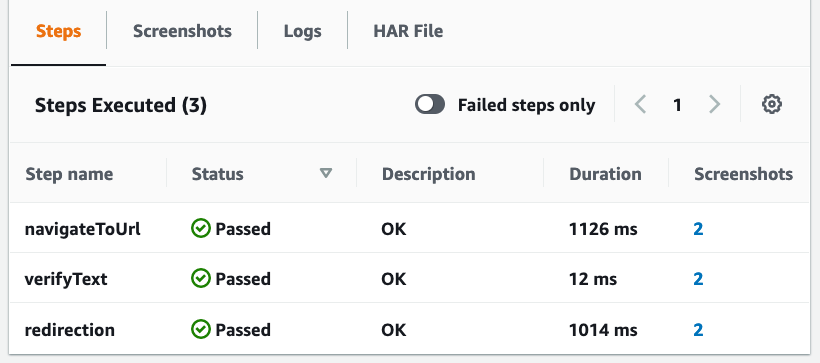
Once the canaries run, you can view a wealth of information about the tests like step durations, screenshots, and logs:
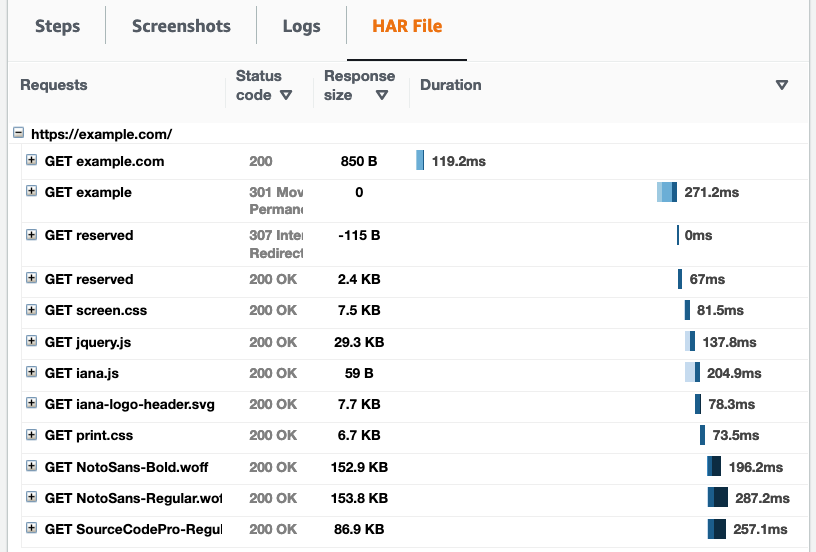
For much deeper debugging sessions, the captured HHTP archive is very useful. This is what you’ll see in your browser’s DevTools as well if you were to load the page manually:
Canary for Backend APIs
Let us now look at creating a canary for API testing. Most of the steps are the same as above. However, select the “API canary” blueprint this time:
If you’re testing an API Gateway API, you can select it next:
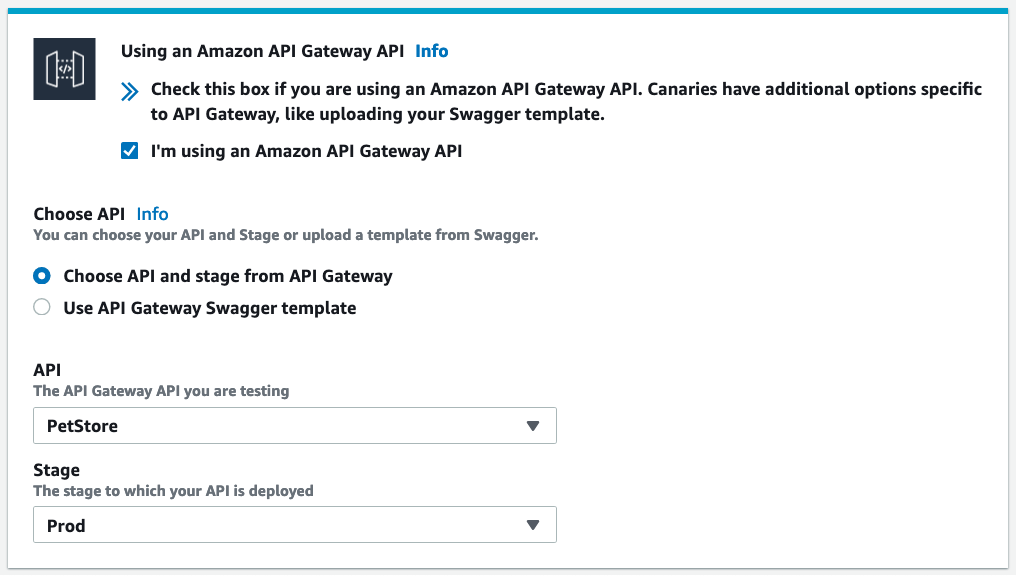
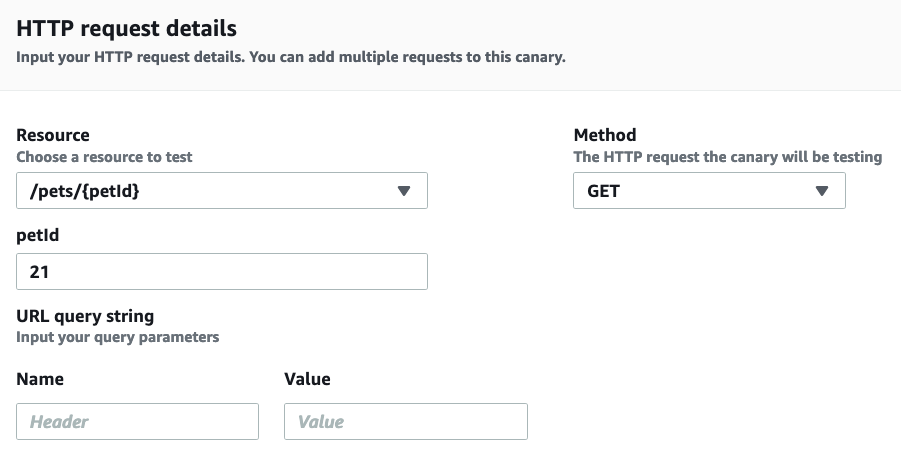
This will auto-populate the API endpoint URL and provide additional UI assistance when you add individual HTTP request steps to test individual API resources:
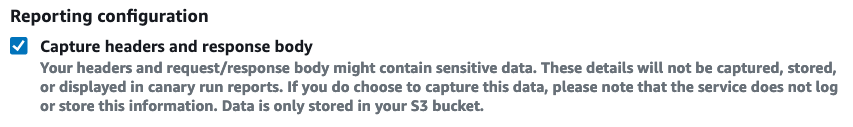
You might want to save your API responses:
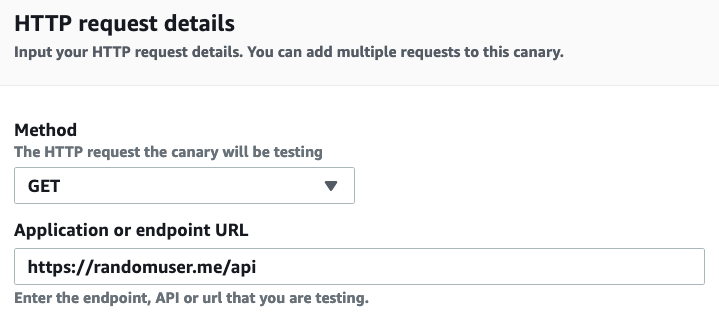
If you’re testing an external API, you have to provide the details for every HTTP request you add here:
As you can see from the generated code, the console cannot add any validation on the API’s response. You’ll have to add it in the code yourself:
var synthetics = require('Synthetics');
const log = require('SyntheticsLogger');

const apiCanaryBlueprint = async function () {

    // Handle validation for positive scenario
    const validateSuccessful = async function(res) {
        return new Promise((resolve, reject) => {
            if (res.statusCode < 200 || res.statusCode > 299) {
                throw res.statusCode + ' ' + res.statusMessage;
            }

            let responseBody = '';
            res.on('data', (d) => {
                responseBody += d;
            });

            res.on('end', () => {
                // Add validation on 'responseBody' here if required.
                resolve();
            });
        });
    };

    // Set request option for Verify randomuser.me/api
    let requestOptionsStep1 = {
        hostname: 'randomuser.me',
        method: 'GET',
        path: '/api',
        port: '443',
        protocol: 'https:',
        body: "",
        headers: {}
    };
    requestOptionsStep1['headers']['User-Agent'] = [synthetics.getCanaryUserAgentString(), requestOptionsStep1['headers']['User-Agent']].join(' ');

    // Set step config option for Verify randomuser.me/api
    let stepConfig1 = {
        includeRequestHeaders: true,
        includeResponseHeaders: true,
        includeRequestBody: true,
        includeResponseBody: true,
        restrictedHeaders: [],
        continueOnHttpStepFailure: true
    };

    await synthetics.executeHttpStep('Verify randomuser.me/api', requestOptionsStep1, validateSuccessful, stepConfig1);
};

exports.handler = async () => {
    return await apiCanaryBlueprint();
};
The rest of the canary creation steps are the same as the website UI canary we created earlier.
Conclusion
Hopefully, you now have a very good understanding of what CloudWatch Synthetics Canaries are and how you can use them to your advantage.
Is there a way to read the Canary status from an external application? And display a Red flag on the application UI if the Canary status is failed?
Yes, since the canary script is your creation, you should be able to fetch canary status from external application. However, to show the canary status on the application UI, you’ll need to store the canary status in a central datastore like DynamoDB & add code in the webapp UI to fetch the status from there.
Hi
can i know, where in the code i need to modify the stepname?
Step name is the first parameter to the
synthetics.executeStep()function:await synthetics.executeStep('STEP NAME', async function () {...});